Today, we will talk about taxonomic and phylogenetic diversity.
The estimation of taxonomic diversitycan be used fully in genetic and evolutionary status, or while comparing communities with the same number of species and individuals. Also, the calculation may be complex ifthe evolution information of the that consider the community are unknown. Often these type of indicators are incredibly efficient in discriminating the different size.
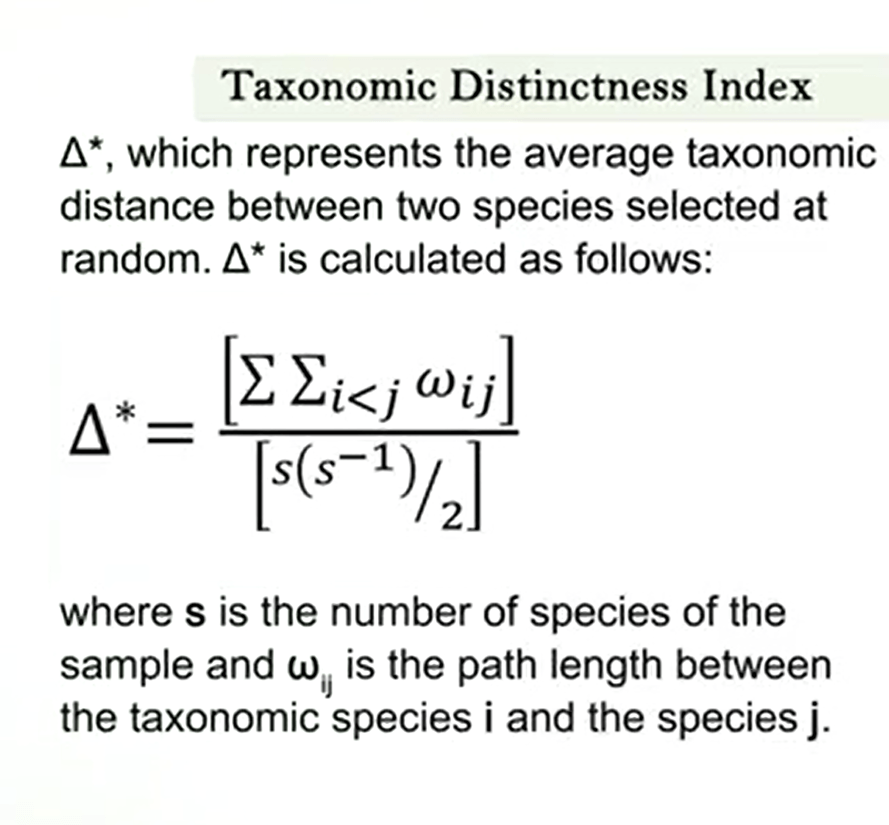
One on the most useful and effective measure is the taxonomic distinctness index of Clark and Warwick. This index describe the average taxonomic distance or in other words the distance between two randomly selected individuals through the phylogenetic tree or the Linnaean taxonomy of all species of the community. This symbol is a delta with a matrix which represent the average taxonomic data’s between two species selected at random and is calculated as followsas you see in this picture.
Where s is the number of species of the sample where ij is the path length between the taxonomic species i and the species j. A method to calculate wij is to consider a value one each evolutionary step in the search of a common ancestor between the two species. So that the species of the same genera will have a value w equal to one.
If the species belong to the same family, but not to the same genera, they would have w equal to two. And if they belong to the same class, w would be six.
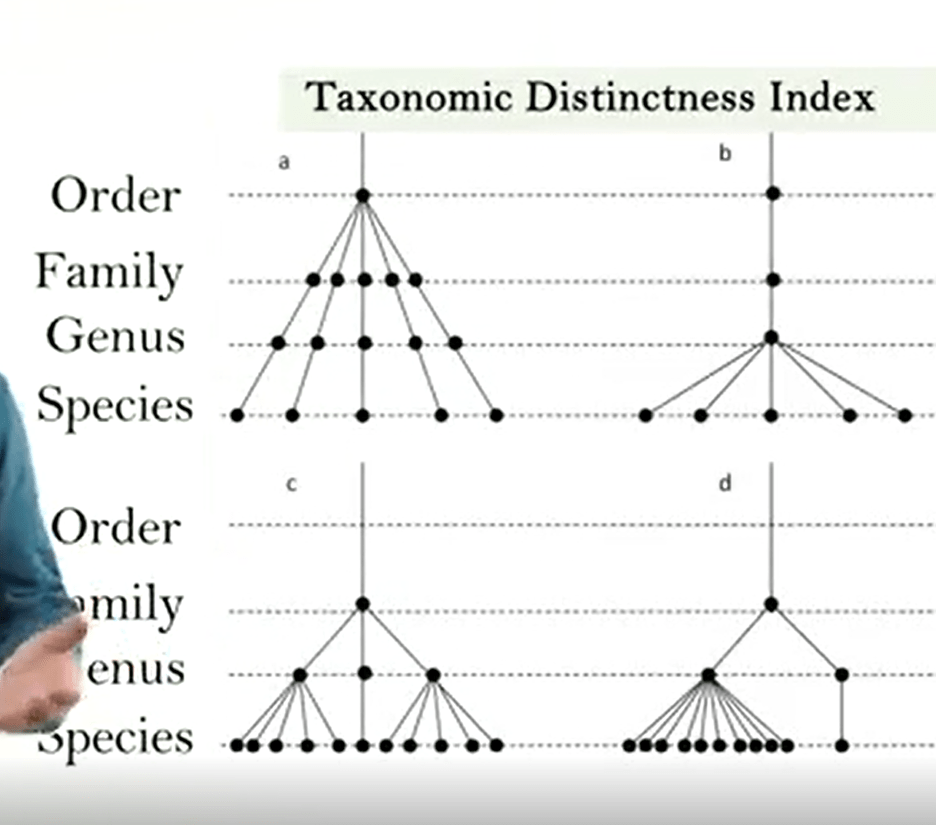
This is an example of the tree for phylogenetic identification of the distance between two individuals of two species of two genera, or two families.
Phylogenetic diversity is the genetic component of the taxonomic diversity. They base it mainly on data from DNA sequencing and the difference between species. It is estimated as the time or quantity of evolutionary change among species analyzed and their common ancestors. One of the most commonly used graphic approach is the phylogenetic tree. This type of schematisation allows oneto understand the relationship between species and calculate the phylogenetic diversity in the evolutionary scale.
These species are usually represented as the leaves of the phylogenetic trees that is extreme aspects of the branches, represented the accumulation of evolutionary changes. The nodes represent the most recent common ancestral species that branch off from that point along the tree, while the or the roots are the common ancestor to the world tree from which the origin of all extant species leaves is presumed. Diagonal the branches can be measured as the elapsed time between a node and the next, or between a node andthe leaf, usually in milli- or or as the accumulation of evolutionary changes able to allow the speciation. The time moderator change is not constant from the one node to another and depend on the amount of adaptation and evolutionary changes that wrote to between one species and its descendants
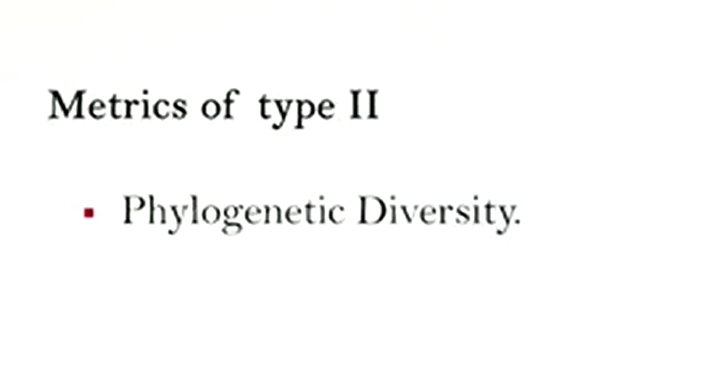
From the analysis of the trees and the study of phylogenetic diversity it is possible to distinguish two type of indexes. Metrics of type one, which calculate the distinction score between species in original phylogenetic tree and then add those of a particular sub-group of interest, and metrics of type two, which start at the local origin of phylogeny, and then for that specific subgroup, assess the phylogenetic properties.
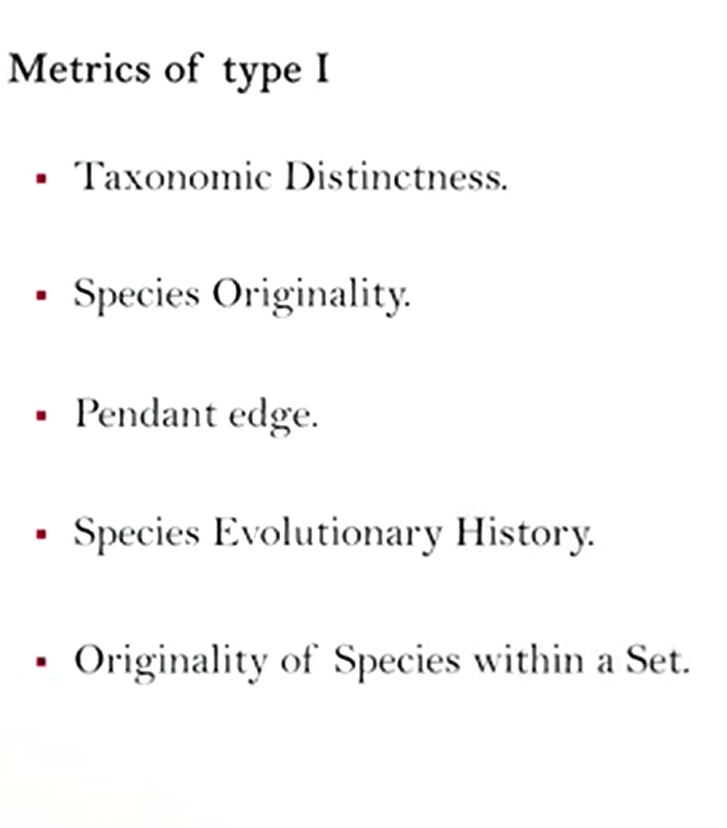
Among metrics of type one, there isa taxonomic distinctness that’s reciprocal of the number of nodes between the species and the phylogenetic tree root, standardized by dividing by the sum of these scores across species and multiplying it by 100. Among metrics of type one the results of species originality that is calculated after having assigned to each node of the tree the value one, if the species descending from the death node with respect to their sister node of the alpha taxa with valid relativeness of first order are greater and value zero if they are minors. The values at that node between one species and the route are added up. So smaller values indicate a great distinction. Other metrics of type one are pendant edge, that is, the length of the branch that connects one species to the remainder of the regional tree. Another one is the species evolutionary history, that is, the portion of the phylogenetic tree assigned to a species. The shared branches are equally divided between the lines of the descendant. Other metric is the originality of species within a set. These are the values of each species that maximize the expected dissimilarity between two species drawn at random from a group.
Phylogenetic diversity is the sum of the length of the branches in the phylogenetic trees portion that connects the focal group of species when working with incidence data. This is equal to the number of branches multiplied by the weighted average of the mean length of the branch with ways equal to the mean species that share that branch by working with nebulous data.
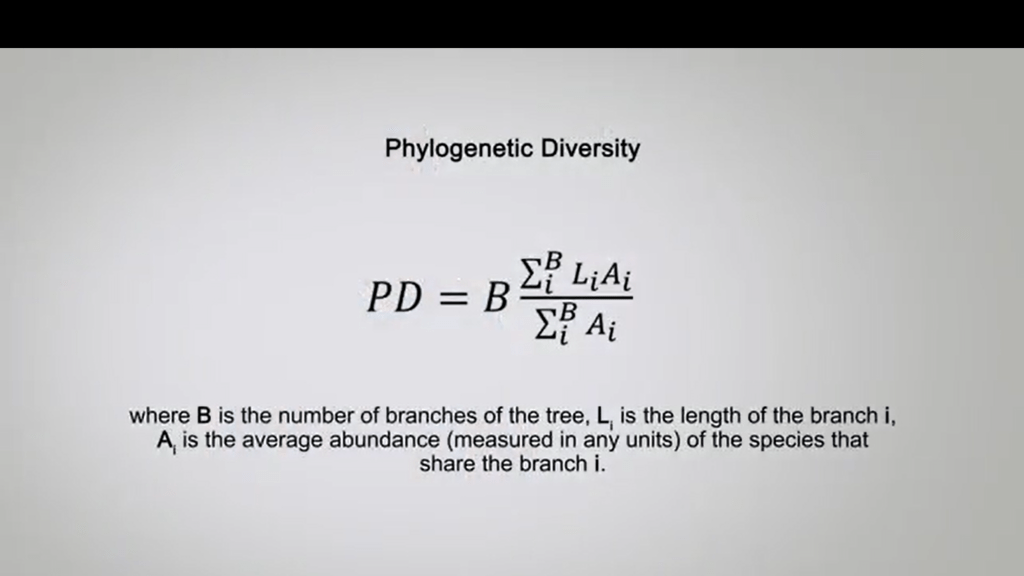
The equation is simply calculated by this formula where B is the number of branches on the tree, Li is the length of the branches i. And A i is the average of abundance measured in any units of the species that share the branch i.
Phylogenetic diversity is a metrics of type II. Another metrics of type II is the mean phylogenetic distance, that is the mean phylogenetic distance between each pair or species in the focal group working with the incidence data.
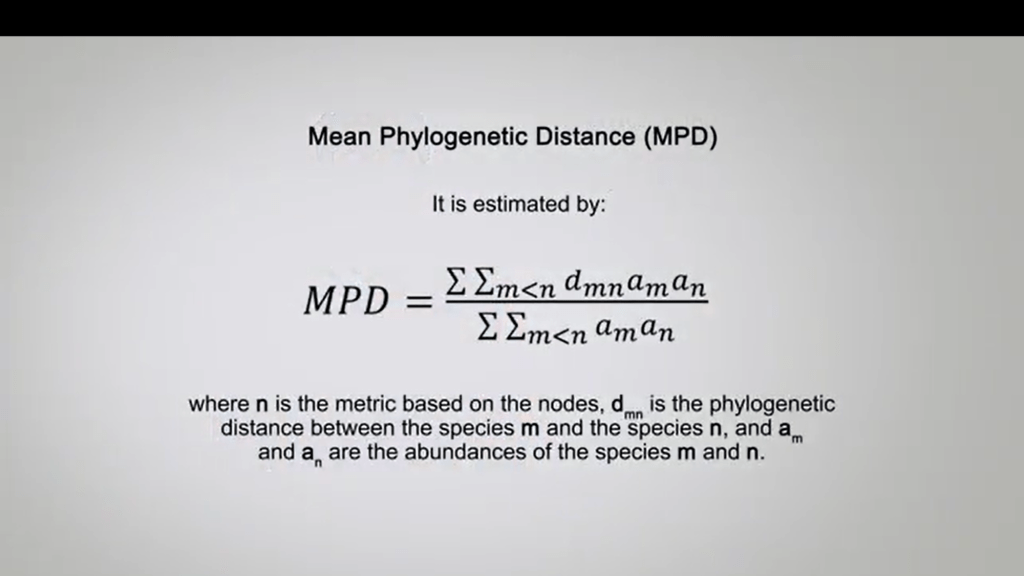
This is equal to the mean phylogenetic distance between pairs of individuals or other units of abundances excluding the pairs belonging to the same species or its variant without exclusion when abundances data are available. It is estimated by this formula, where n is the metric based on the nodes, dmn the phylogenetic distance between the species m and the species n, and am and an are the abundances of the species m and n.
another metrical type II is the sum of phylogenetic distances, that’s the sum of the distances between each pair of the phylogenetics species equivalent to MPD mostly applied by the number of pairs or the species for incidence data.
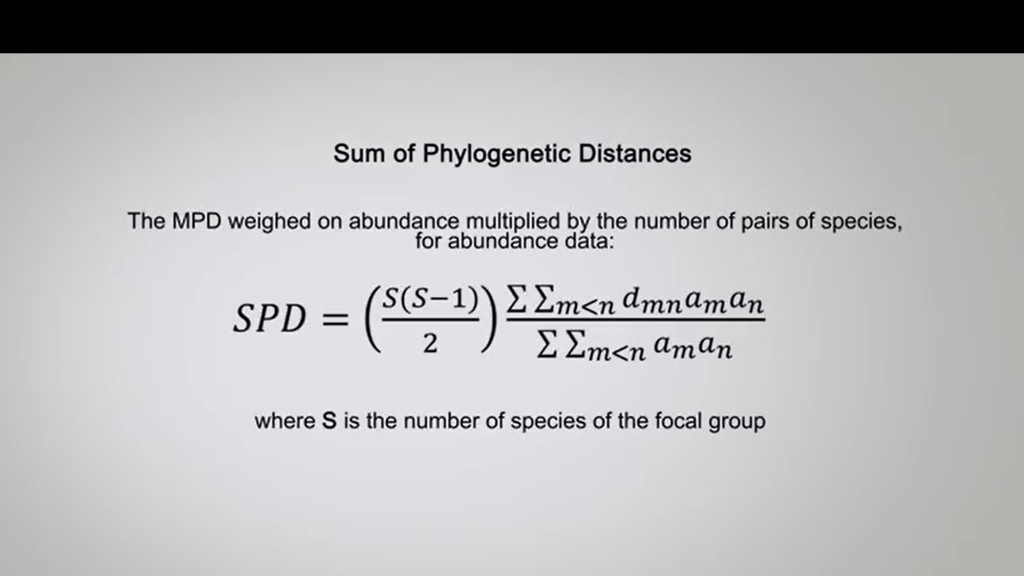
The MPD weighted on abundances multiplied by the number of pairs of species for abundance data Is showing in this formula, where S is the number of species on the focal group.
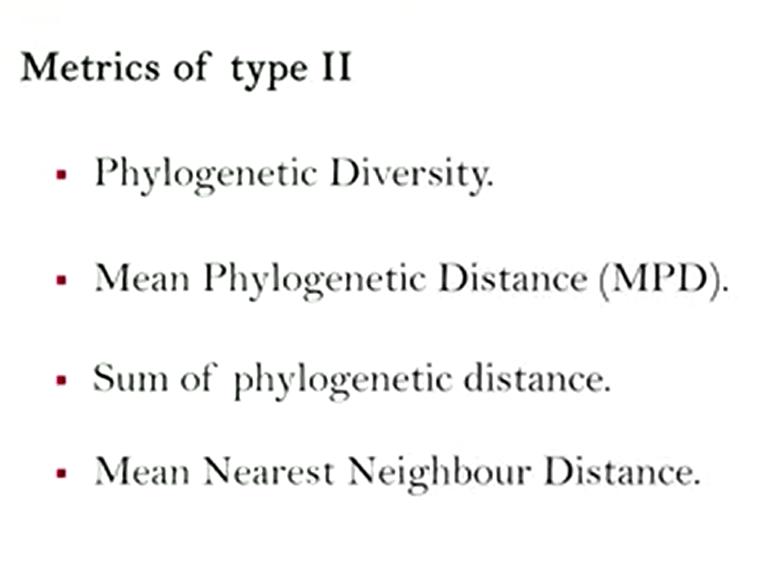
We can also calculate the mean nearest neighbor distance, that is another metric of type II, that is the mean phylogenetic distance between each species and the nearest relative in the focal group or species.
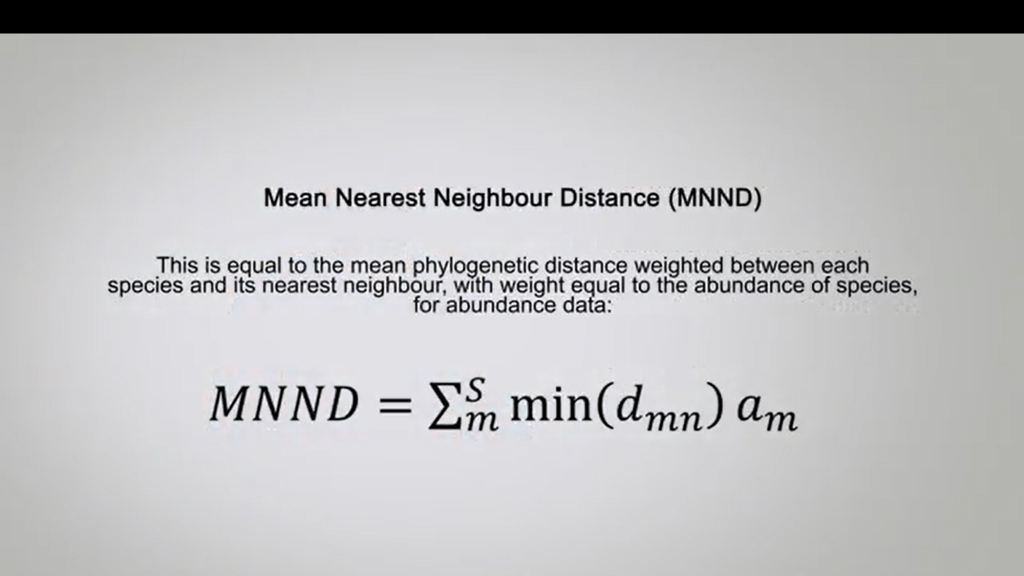
For instance, data or that is equal to the Mean Phylogenetic Distance weighted between each species and it’s nearest neighbor, with the weight equal to the abundance of species for abundance data. The calculation is simply shown in this formula. As a general advisors, in case all the metrics based on the position of the nodes are available, it is recommended to use a taxonomic distance index. While if metric based on the distance, branches are available, the phylogenetic diversity and the index of species evolutionary history have to be preferred to data originality to species within a set. That’s all for today. Let’s see you next lecture.

Legg igjen en kommentar