Today I’m going to explain to you howto compare communities diversity.
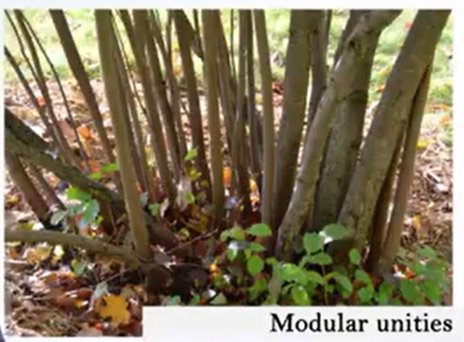

To be able to compare community, we first need to understand what to count as an abundance, because we can count different things. For instance, we can count the number of individuals, but in some cases, one for instance, we have trees and spruces from trees. It’s very difficult to understand what is an individual and what is a different individuals. So, in that case we can count, for instance, modular unities or densities instead of individuals or biomass or, for instance, percentage of coverage.
We can use squares, we can use different sampling techniques.
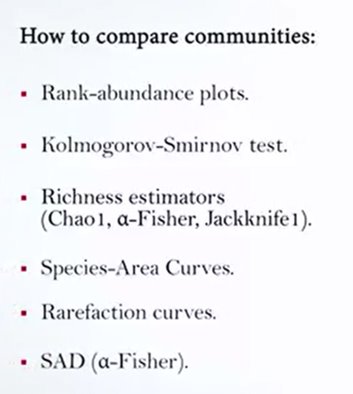
In any case, we need a surrogate to account for the differences in biodiversity between different samples. Which method we have to compare communities? One of this is the rank-abundance plot. As I show you, the rank-abundance plot is very interesting because you can use two different courses to understand which one is which richer? Which one is more species? Which one is even? The Kolmogorov-Smirnov test is another way to have a statistical variable meter to understand the difference. So if the difference is statistically relevant or not. Richness estimators also use, for instance, Chao 1, alpha Fisher, Jackknife because they estimate the affected number of species and are very useful to understand. Which community is richer than the other one. Another way is to use the species-area curves as a cumulation curve or rarefaction curve to understand the differences in community. Or we can use the Species abundance distribution and calculate the alpha-Fisher.
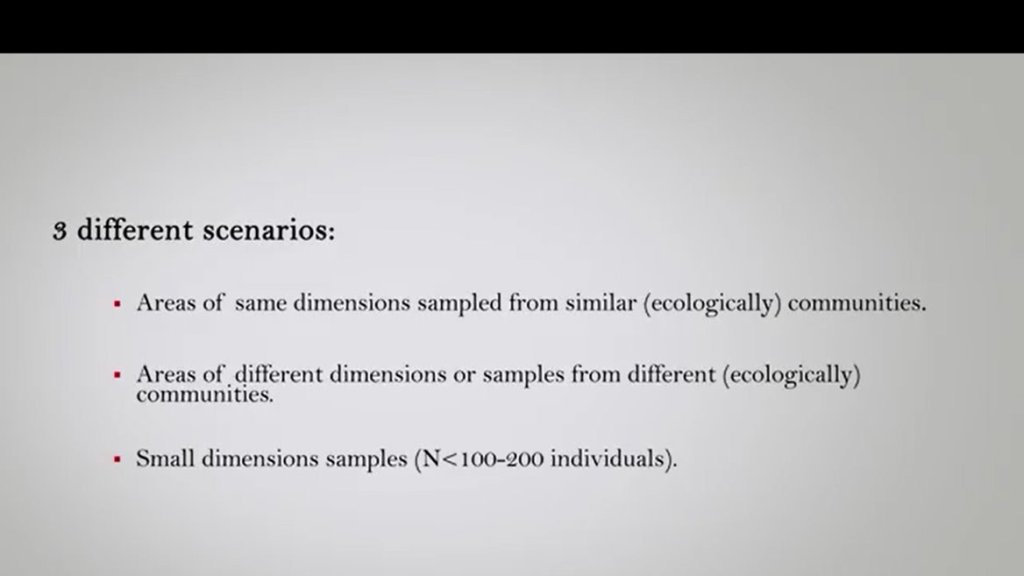
We could have three different scenarios. The first one is that we have areas of same dimensions sampled from similar (ecologically) communities. The second one is that we have areas of different dimensions or samples from different(ecologically) communities. The third different scenario is that we can have a small dimensional samples that is a scenario very often that, and we have number of individuals that is minor of 100 or 200.
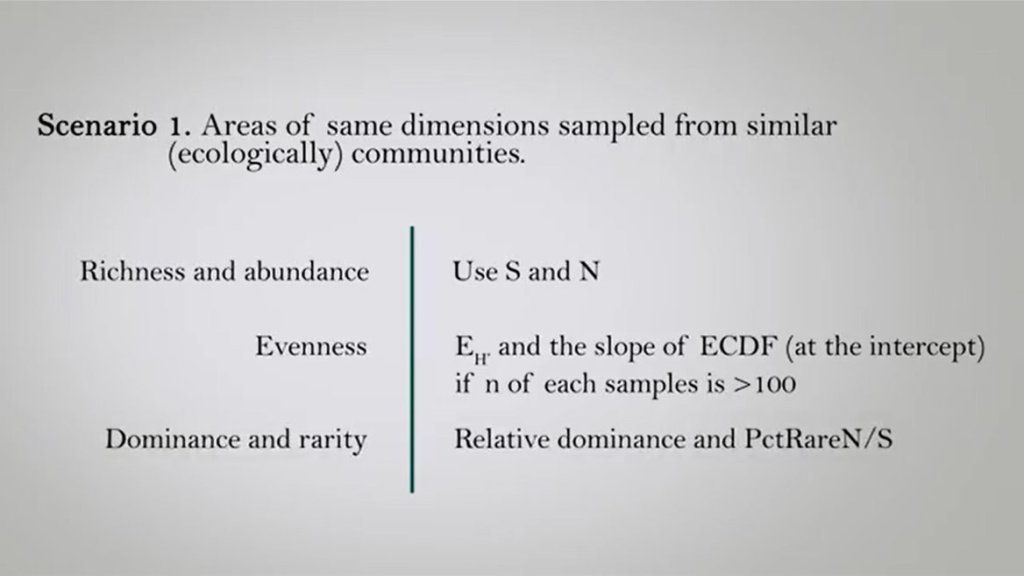
In the first scenario, I mean, again, the areas of the same measured samples from similar ecological communities. We can use richness and abundance such as S or N. To compare communities are very useful index to compare evenness of the two samples is the EH and the slope of ECDF as a graph as they intercept if n of each samples is measured than 100 Individuals.
And if you want to understand differences in dominance and rarity, we can just use the relative dominance and the percentage of rare number of individuals divided by number of species, so PCTR are N divided by S.
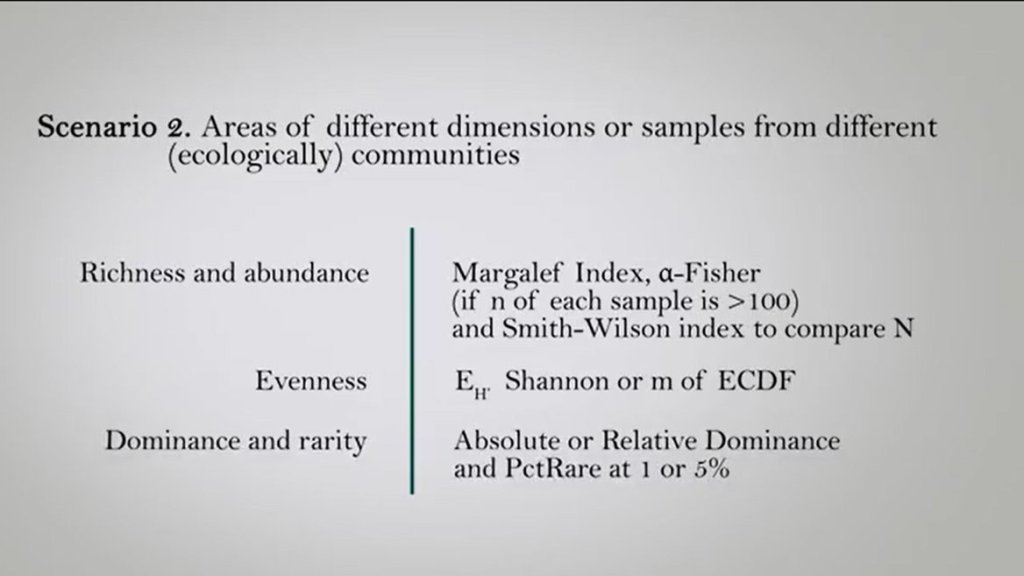
For the second scenario so if we have areas of different dimension or samples from different ecologically community we can use for to estimate the differences in their richness and abundance the Margalef Index or the Alpha Index if n of each sample is measured in a 100 or there the Smith-Wilson index to compare abundances. If we want to understand the difference in the evenness we can use evenness of Shannon or the M of ECDF. So there’s no, and to understand the difference between dominance and rarity we can use absolute or relative dominance. And percentage rare at 1 or 5%
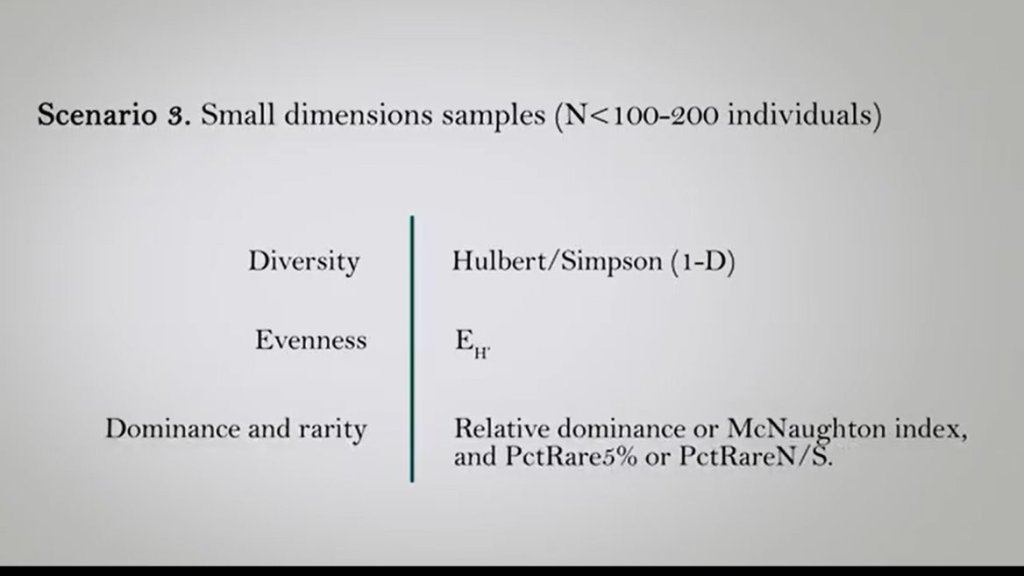
In the third case where the samples are of more dimension means that the number of individuals are less than 100 or 200. We can use to evaluate the differences in diversity between the two samples the Hulbert Simpson index that is very scalable in cases more dimension samples And we can use 1- D, so1 minus the Hulbert/Simpson Index. To evaluate the differences in evenness instead we can just use this evenness. For the evaluation of dominance Dominance and rarity, relative dominance or McNaughton index is very useful. And for rare species, the PctRare5% or the Pct RareN/S are very useful indicators. Moreover, we can use statistical tests to understand if these differences between communities are more orless statistically evident.
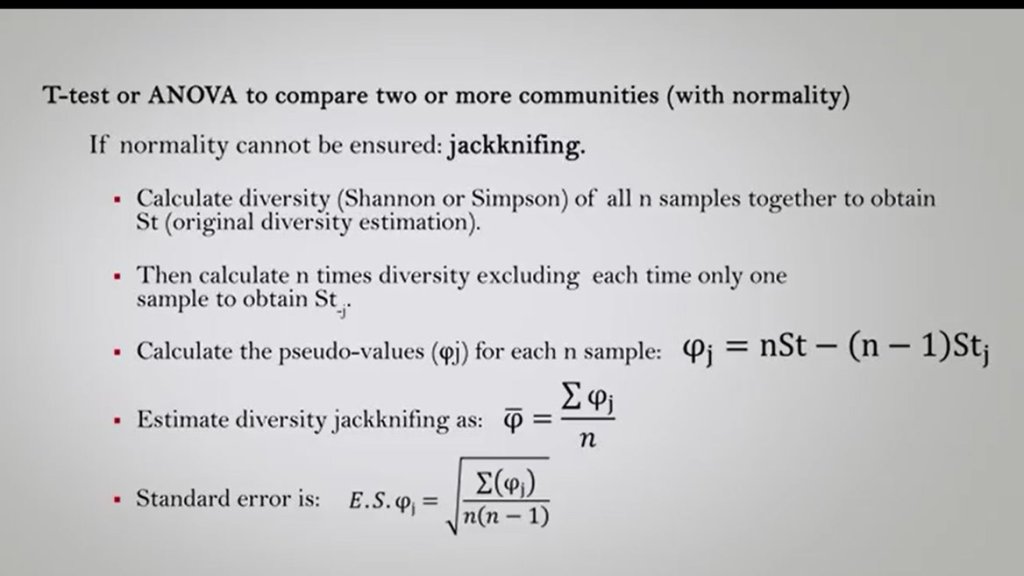
And for rare species, the PctRare5% or the PctRareN/S are very useful indicators. Moreover, we can use statistical tests to understand if these differences between communities are more or less statistically evident. And one of these is the T-test or the ANOVA test to compare two or more communities in case of normality of data distribution. If normality cannot be ensured, we can use the jackknifing process. To use the jackknifing process is very simple. We need just to calculate diversity, the Shannon or Simpson Not very important. We can use one or these two. And of all add samples together to obtain a kind of aesthetic, so the original diversity estimation. Then we calculate n times the diversity excluding each time only one sample to obtain. Minus one, or minus j. Then, we calculate the set of values for each n samples that is just nst, minus n, minus one. Of sti, deity or j, depends on our sample. So, we will remove from the original diversity estimation. The diversity of each sample we removed and we estimate the diversity jackknifing as the sum of this pseudo-values divided by n. That is the total number of samples. In this way, we can also calculate the standard error That is simple. The standard error of the estimation of jackknifing process, and we have a variable statistics to provide information about the evidence in differences in statistical communities. So this lecture tried to show you how to compare different communities. And I hope you will use these tools to compare your data and evaluate difference in your biodiversity data. See you next time.

Legg igjen en kommentar