Today we will see how to analyze anthropogenic impacts on biodiversity. What are anthropogenic impacts on biodiversity.
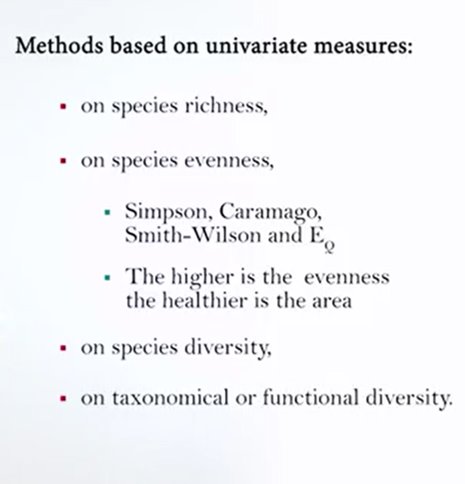
For instance we have deforestation, that’s a very big problem. We have over fishing, pollution, water pollution, garbage pollution. So a different way to impact biological diversity. To analyze this impact, we have different methods. There are some methods that are based on univariate measures. For instance, indexes that are based on species richness. So the effect of disturbance is more evident on abundances. There are indexes based on species evenness that is better response to disturbance. And we can use different way to measure this. For instance, we can use the Simpson Index, Caramago Index, Smith-Wilson Index, and the Q evenness. The higher is the evenness, the healthier is the area. Indexes that are based on species diversity are also used, but are difficult to evaluate if you want to compare these impacts we need to provide good information or real good information of the difference. And we use different diversity that includes both information from richness and evenness. These can be confounding. Also the indexes based on taxonomical or functional diversity. That we will see next lecture, they are very useful to understand this univariate measure of the impacts of biodiversity.,
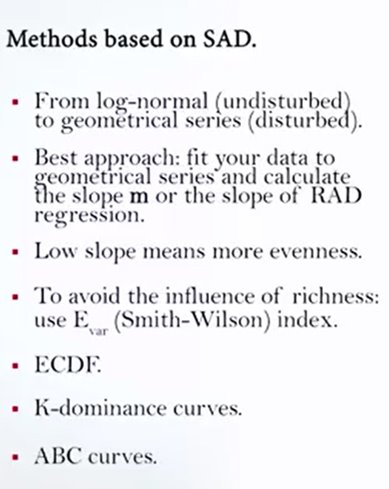
We have also admitted that our basis on species abundance distribution. This methods try to assess the impacts of biodiversity, that moves from log-normal, that is, a kind of proxy of undisturbed size, to geometrical series, that mean that size are very disturbed. If you remember from the last lectures, we have different ways to show all the abnormalities distributed inside the species. So log-normal is the best way because it means that community is healthy. And it means that inside is undisturbed. Geometrical series is why we have big domicile species kind of synonym of disturbance. The best approach is to fit our data to a geometrical series and then calculate the slope m or the slope of rank abundance distribution regression. In this way we analyze if the site is very disturbed or not so much disturbed or completely undisturbed comparing the slope and the regression of the RAD. Low slope means that there is more evenness and so that the side that we are analyzing is undisturbed. High slope means that the evenness is very low and in this case the side is disturbed because there is dominance of species. To avoid the influence of the richness we can use, the evenness of Smith-Wilson. That’s very useful in these cases when we want to analyze the impacts of biodiversity. Another way, another meter of species distribution to analyze the impacts of biodiversity Is the ECDF, the empirical cumulative distribution function, or the K-dominance curves. And the last way is a new system, a new graph, that I want to show you to analyze the impact that is ABC curves. ABC curves are curves that are based on the distribution of abundances and biomass. So we use ABC curve to analyze the effect of impacts of biodiversity, because biomass grow in a different way with respect to biodiversity when the site is disturbed or not.
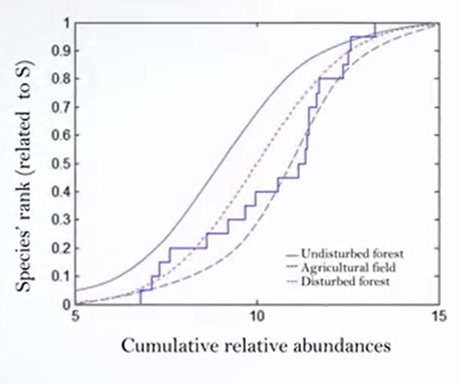
So do you remember from the last lectures that we started to analyze what is an ECD curve. So empirical cumulative distribution function curve. The empirical cumulative distribution function is a powerful graph to understand what are the impacts, or topogenic impacts on biodiversity. For instance in this example you will find three curves. And the highest one is the undisturbed forest, the intermediate one is a disturbed forest, and the lowest one is an agricultural field. You see the agricultural field, for instance, as the intermediate part of the cube that is quite parallel or more parallel to the epsilon axis if compared to undisturbed forest. Moreover, the undisturbed forest is the left low part that is higher than the other two groups. This means that the number of rare species in the undisturbed forest is higher than the other two.
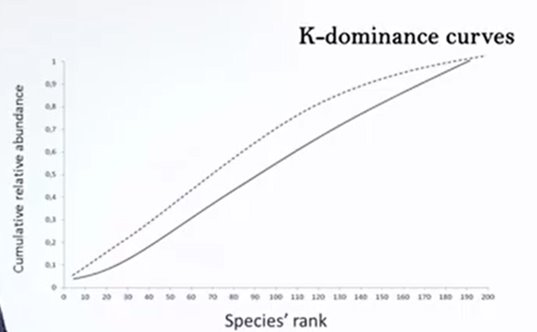
Another way to analyze impacts on biodiversity is K-dominance curves. You see in this example there are two curves, and the highest one means that the community in that case has more biological diversity, is more diverse, than the second one. So the curve that’s placed itself on top of the graph is more diverse, and the curve that is below the others is the lower diverse.
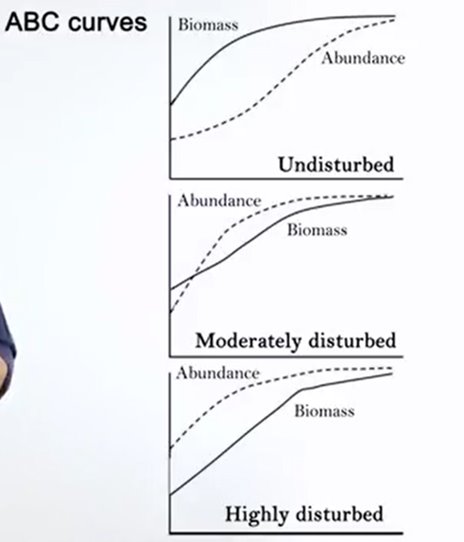
A third interesting way to analyze the affect of anthropogenic impacts on biodiversity is the Abundance Biomass Curves, the ABC curves. From these curves you can monitor what are the effects. In this example you will see three different communities.
One is undisturbed, the second one is moderately disturbed, the third on is highly disturbed.
If you put on the x axis the species rank in a log, and on the epsilon axis, the biomass or the abundance cumulative of each species, you will see that in undisturbed places, biomass curve is always over the abundance curve. It means that the biomass of the system is higher than single number of species. In the intermediate disturbance side instead you will see that the two curves cross many times. It means that abundance can be sometimes higher than biomass and this is because some species grow faster than the other because the site is disturbed. For instance, by other species, is that this is condition that you can see that on the disturbed side, the number of individuals is very high because there are pioneer or invasive species that can arrive in and then can grow fast, but they can not accumulate much biomass, so Analyzing these two codes and the behavior. So when you see that biomass is higher than abundance, then you can understand that the site is undisturbed. When they cross many times, that’s moderately disturbed. And when the abundance curve is higher than the biomass curve can understand the society’s highly disturbed.
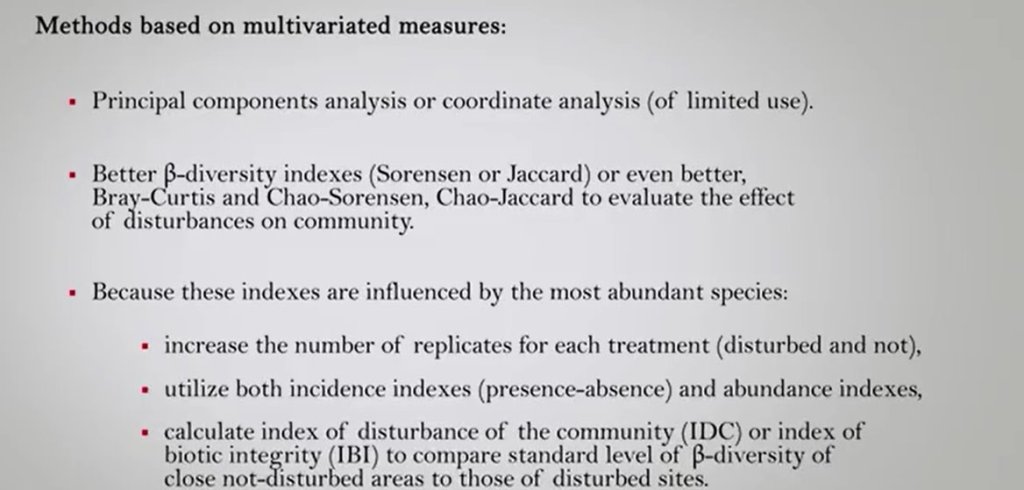
The third way to assess the impact on biodiversity are methods based on multivariate measures. These offerings as principal components analysis or so called PCA or coordinate analysis but sometimes they are of limited use. Is it better to use beta-diversity index for instance if we want to use multivariate measure. We can use Sorensen or Jaccard or even better Bray-Curtis or Chao-Sorensen, Chao-Jaccard to evaluate the effect of disturbance on community. Because these indexes are influenced by the most abundant species, it’s very important to increase the number of replicates for each treatment. For instance, the disturbed and not disturbed side. And utilize both incidents, the indexes, for instance, presence, the hub sense data, and abundance in indexes. Also it’s possible to calculate some kind of index of disturbance of the community or IDC or index of biotic integrity that is called IBI. To compare standard level of beta diversity to close not-disturbed areas to those of disturbed sites. So we can have a different comparison to understand how big is the impact onthe biodiversity of the community. So thanks for your attention, and see you at the next lecture.

Legg igjen en kommentar