Hi guys, welcome to the forth lecture of course Biological Diversity Theories Measure and Data Sampling Techniques. Today we will talk about alpha diversity.
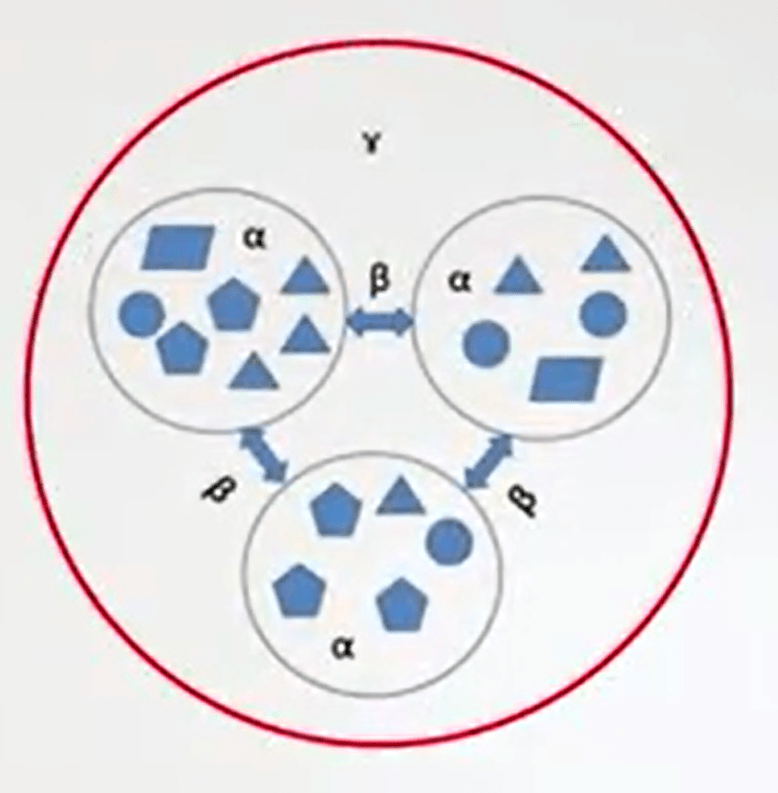
There are many kinds of diversity. Alpha diversity is just one of these. It’s the diversity in individual or sample unit. Beta diversity is another kind. It’s the amount of compositional valuation in a sample, a collection of just the sample units.
Gamma diversity is the third kind of diversity, the overall diversity in a collection of sample units, often in a landscape level diversity.
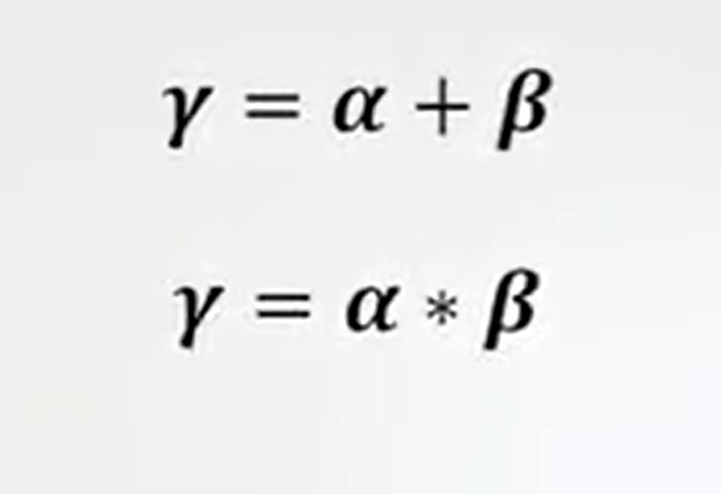
There are some relations with the three forms of diversity. One is that gamma diversity is equal to alpha plus beta diversity. Another one is that gamma diversity isjust alpha multiplied by beta diversity.
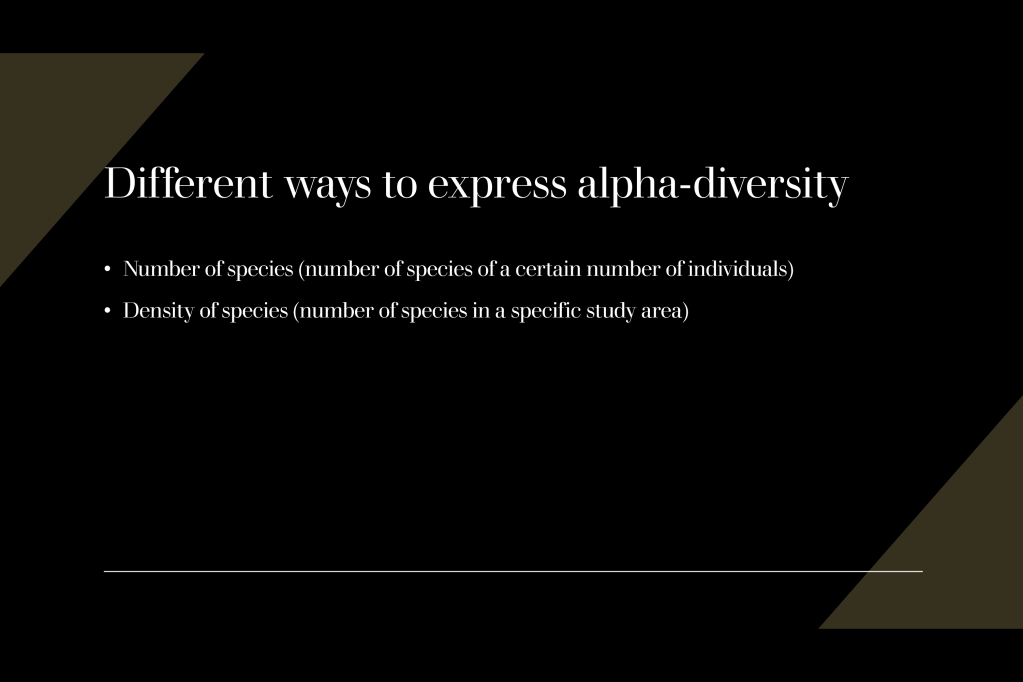
There are different ways to express alpha diversity. One is just the number of species, the number of species for a certain number of individuals. The second is density of species, that is number of species in a specific study area.
There are also three different ways to collect data. There are data on an individual basis, that means that you collect the species just because you are collecting individuals. There are data, there are sampling basis data. It means that you, I fixed it that kind of selecting units or your sample unit is already fixed. And then when you sight it you go down and you collect your individuals. And then you check species that are inside these individuals.
And there are incidence data, that means that you are not collecting the abundance of species but you are just collecting the species name. So they are kind of checklist with species name.
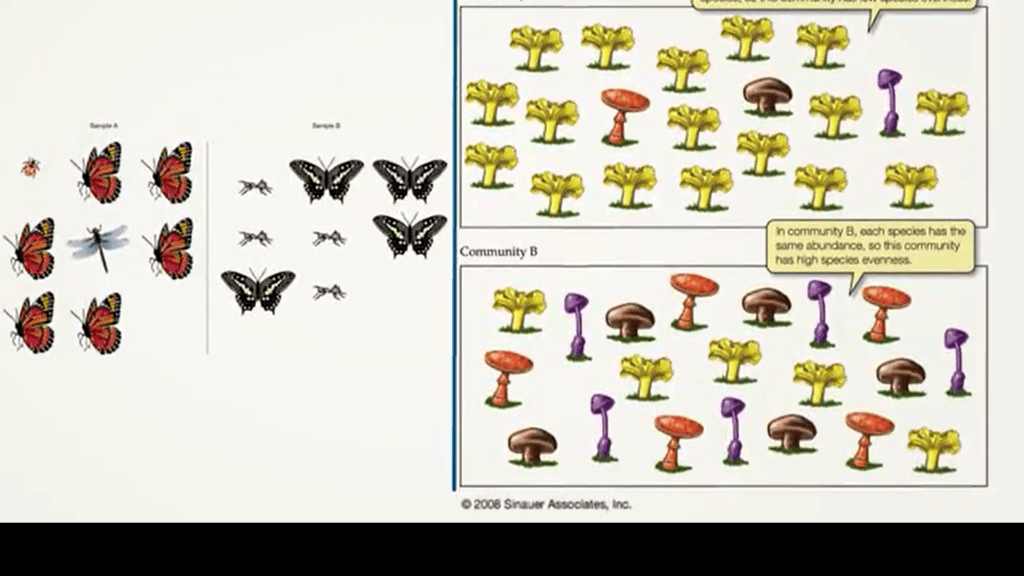
Alpha diversity can be also divided in two components. The richness and the evenness. So, it means that there is a kind of relation between richness and evenness that form the diversity. Here we see that richness is just the number of species in a certain place or in a certain number of individuals, and evenness is how these individuals distribute inside within the species. We have richness indexes of different forms. The simplest one is the species richness.
That is just the number ofspecies in a certain area. Of course this is good information, but it is not enough to express how this species are distributed along the abundance level.
So there are species that are very rare. So, it means that they are less detectable. So, you cannot understand how many of them are in your sample. You just know the number of species, that it’s just a fixed number, 50. 50 species means that you have just 50 species. But you don’t know which is the most abundant, which is the most rare. Always distribution of individuals.
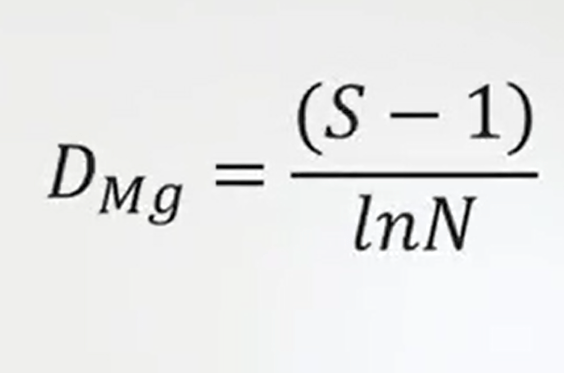
Another way to express the richness index in a more complete way that includes also some information traits on the total abundance are the Margalef and Index. Margalef Index is just a number of species minus 1 divided by the logarithmic number of individuals.
It means the total abundance, Mineski index is and it is very simple because it just divides number of species. So the total richness by the root square of the number of individuals, so the total abundance.
There are also index of species estimation. It means they tried to estimate the absolute number, or the effective number of species in the samples. These are based on mostly on an array of species. It means they include information. They usually is excluded because when you go to sample, you lose information on an array of species that are less detectable and you cannot understand how many of them are in the sample.
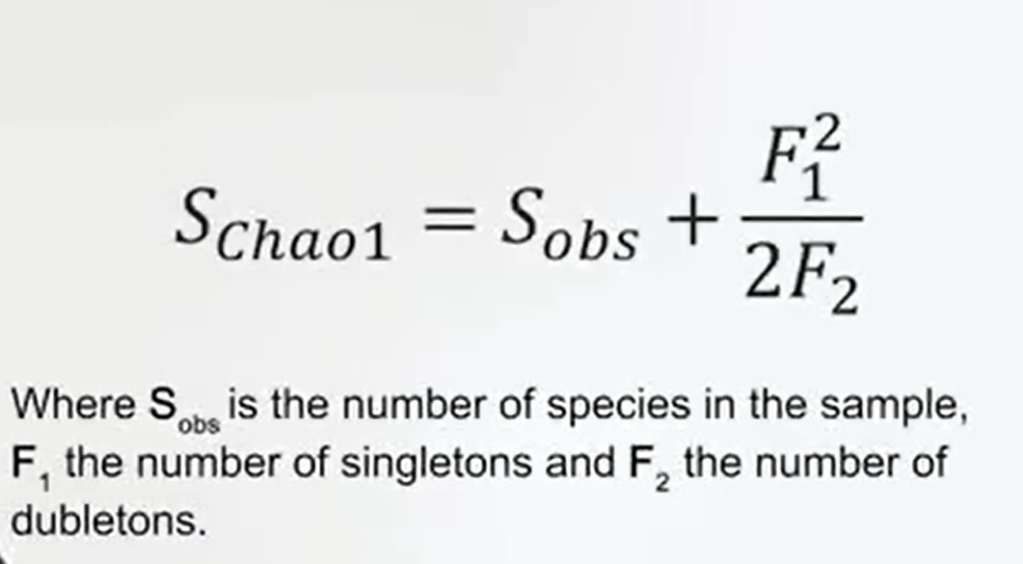
So one of these is the Chao1 Index. Chao1 Index just some ofthe species observed, so the species that you have in your sample,to the array of species. It means that sample species observed plus the number of singletons, the squared number of singletons divided by 2 multiplied with the square number are doubletons. Singletons are the species that are sampled only once in your sample. Doubletons is the speciesthat you collect two times so it means the abundance is two of the species.
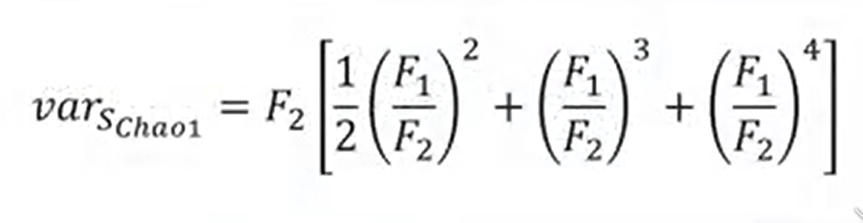
You can also calculate for the Chao1 Index a kind of variance. And this variance allow you to estimate the limit of your estimation, of course.
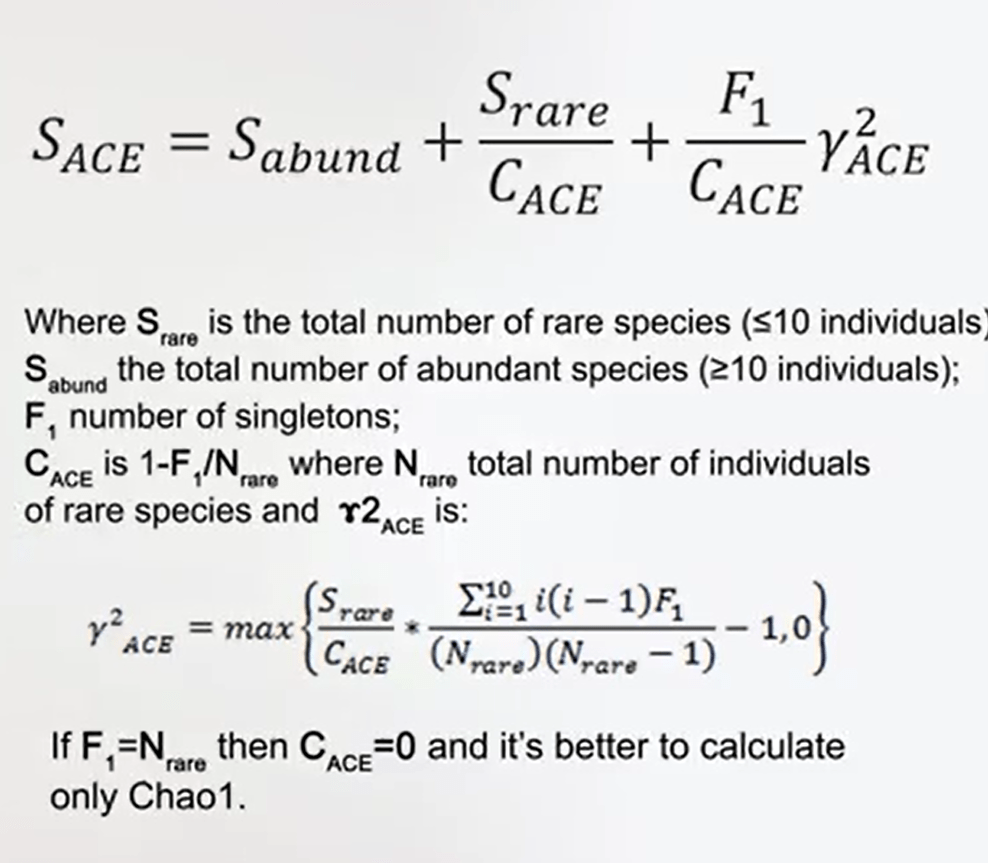
Another way to estimate the effective number of species is to abundance-based coverage estimate or ACE. This ACE is very similar to Chao1 Index. You just the sample of the so the species abundance, the richness of your samples. Two, the species that are rare, this means that species that has less then ten individuals divided bya factor that is called the C ACE. That is just one minus the number of singletons divided by the total number of individuals of rare species plus the number of singletons divided by this same factor and multiply for a gamma square factor that you can calculate with the formula that I provide in this picture.
If you have all the incidents data, you can calculate a similar index, that is the SICE. It means that this is based on the incidence data. So, you can use the same formthat I provide with ACE, but with all the incidence data. Always in the case of incidence data, you can use another two incrementals.
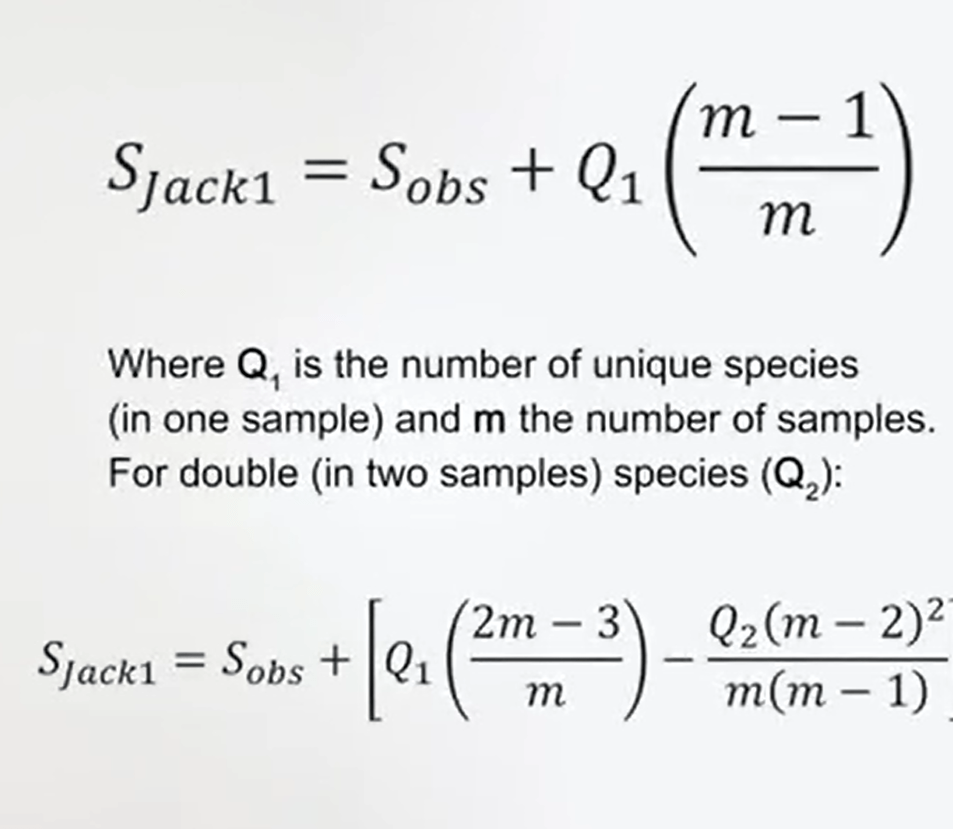
One is the Jackknife estimator. The Jackknife Index is a measure that’s number of species observed in the samples plus the number of samples when you observed only one or two species. That’s very useful, because if you don’t have the abundance of species you at least you can use anyway your data to estimate the effective number of species.
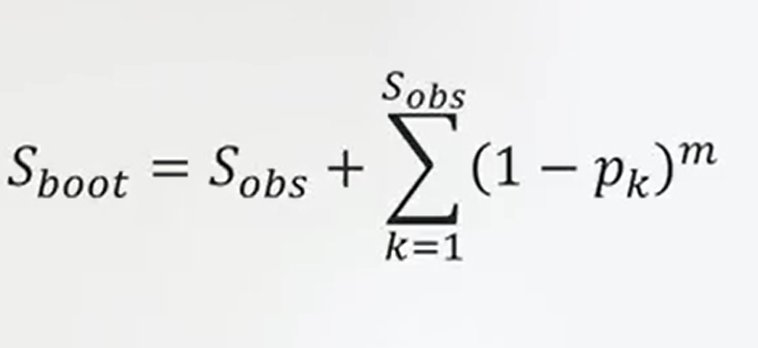
Another measure of the effective number of species is the Bootstrap estimator. It just eliminates and randomizes the samples in different order just to have an information so it sums the number of species observed to this continuous resampling.
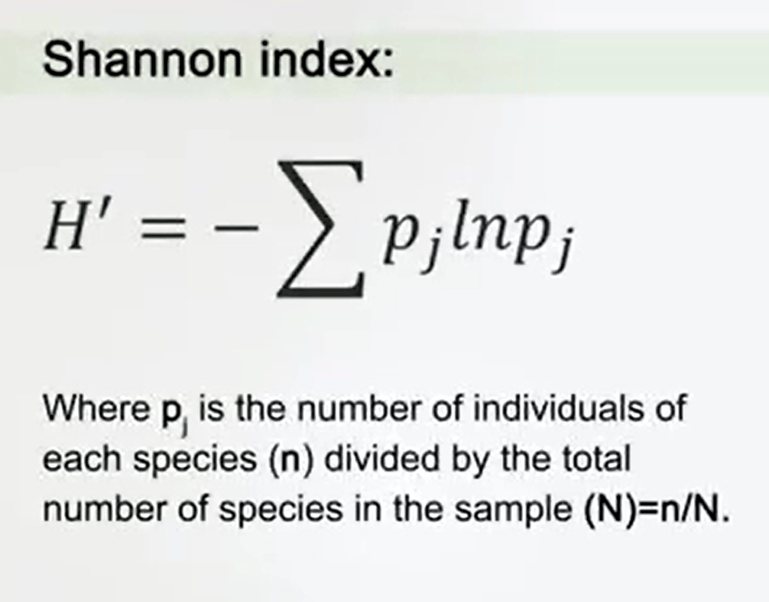
o as I told you, richness is just one part of the information. But if you want to understand how is the diversity here, how much is the diversity of your samples, of your treatments, if you are analyzing different impact, for instance, on the ecosystem. You need to know what is the diversity, and there are two that are the most commonly used indexes of measure that are the Simpson Index and the Shannon Index. Shannon Index derives from the interior of information, and it was developed by Shannon just to understand the quantity of information in telecommunication, in phone communication. And then, it was adapted to ecological studies. For instance, Shannon index uses the sum of the relative abundances of the species. For instance, in this case you see that the factor pjis just the number of individuals of this species (n) divided by the total number of species in the sample N.
So in this case,this index as to usual limits that one is the minimum level that you can raiseyour diversity that is almost 1.5 and the maximum level that you can reach that is maximum 3.5. So very diverse environment has the kind of reach or index that is almost approaching to four. Very poor diverse environment asare any index that is close to one.
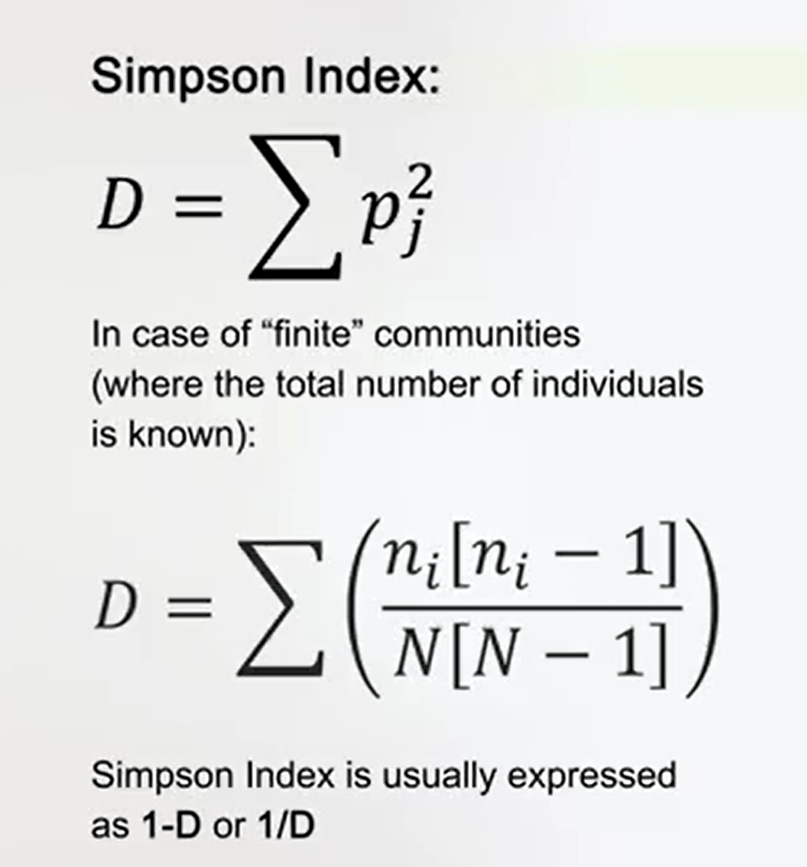
Another very similar index is the Simpson index. Simpson index use the same proportion between a number of individuals of each species and total number of individuals, and is just the square of this value.
So, the sum of this proportion for every species. This is very useful in case of finding community-wide the total number of individuals of course is known. So, what you can use this index just subtracting -1 to have a more available information. Simpson Index is usually expressed as 1- the index so 1 divided the index. It means that, in this way, you canhave an index that goes between 0 and the maximum value of 1.
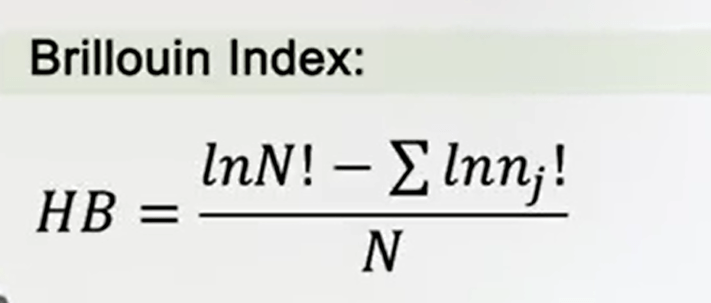
The Brillouin index of diversity is very useful when you. Not all species can be detected, because of difference in the sensitivity of sampling methods. The Brillouin index is simply the total abundance factoral value minus the sum of the logarithm, or the abundance of each species is always factor divided by the total abundance.
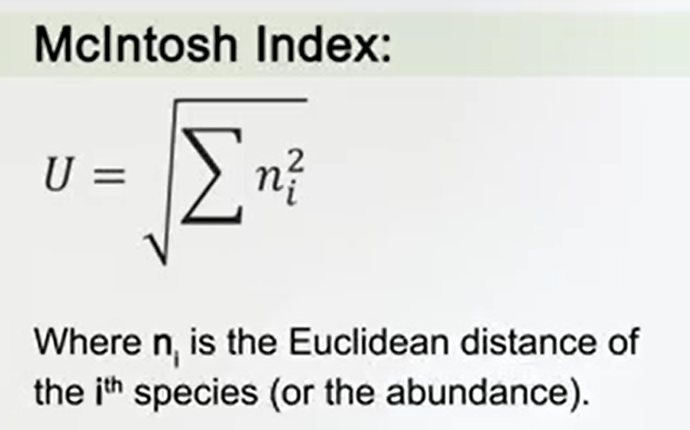
Another way to express the diversities the McIntosh Index. It considers the community as a sample point in the volume and dimensional fr which the Euclidean distance Is in the sample from the region can be useful to estimate the diversity. It is just the root square of the sum of the Euclidean distance of each species, or the abundance of each species from, of course, the n dimensional upper volume.
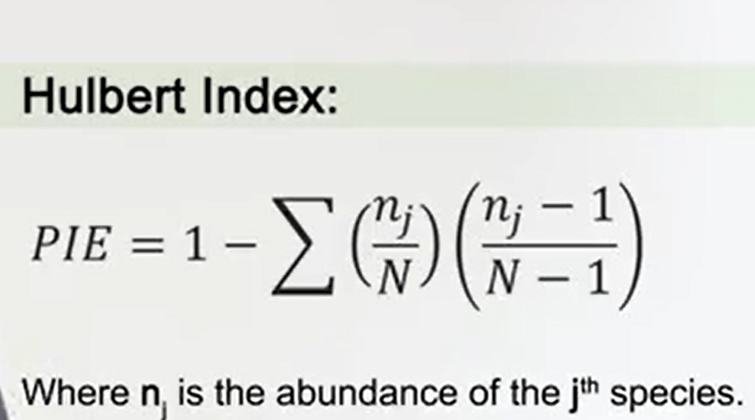
In 1971, Hulbert noticed that a useful measure ofdiversity can derive from the probability that an interaction between two individuals of the same species happened. It means that we can calculate the probability on an interspecific meeting, and it’s called the Hulbert Index.
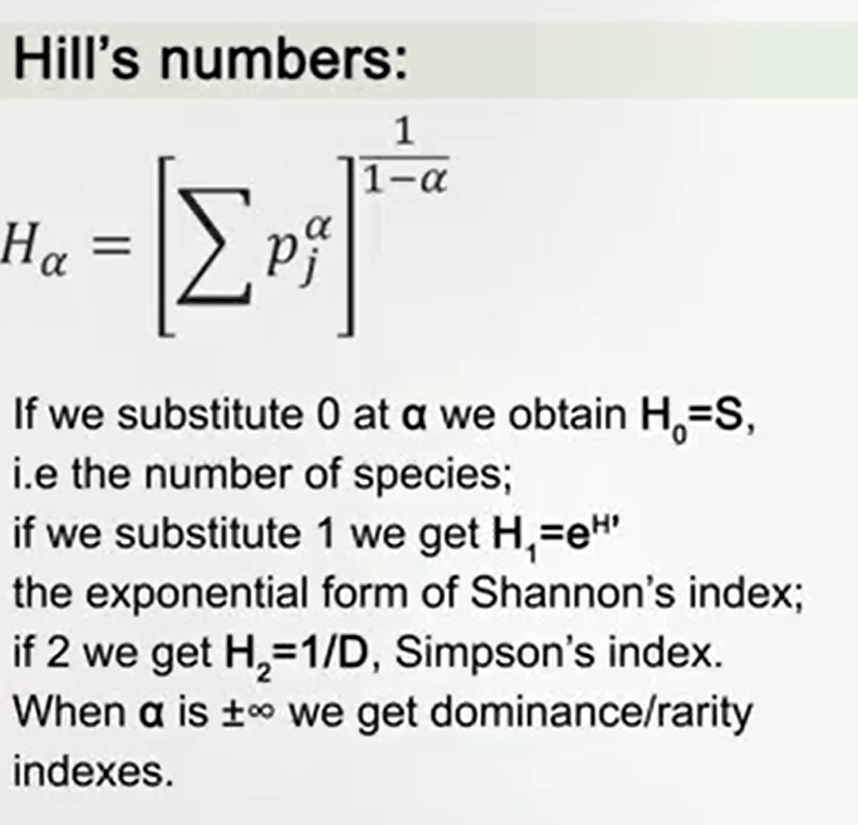
Later, provided a meter to summarize all these indexes of diversity, and they are called andare well-known as Hill’s numbers. If we substitute 0 at alpha,we obtain H 0, that is just S, such as just the number ofspecies or richness, simple information. But if we substitute 1 we get exactlythe exponential form Shannon index. When we substitute 2 to this formula, we will get the inverse formula ofSimpson, so the inverse of Simpson index. And why we substitute plus orminus infinite, we got dominance or rarity indexes. So you see that this is verysummarizing formula to express most of the index that I already explained[INAUDIBLE] going to [INAUDIBLE].
So where we have low values of alpha, this formula gives moreimportance to various species. But when we have higher value of alpha, this formula gives moreimportance to dominant species.
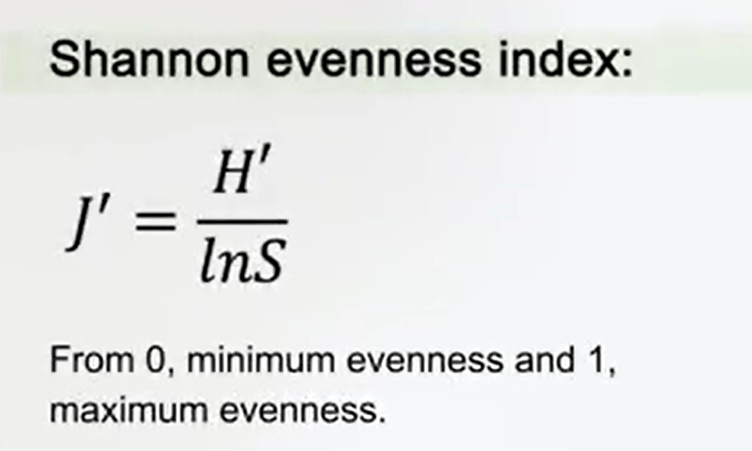
The second component of the diversity, as I’ve told you, is the evenness. So, it’s a kind of expression ofthe homogeneity of the distribution of abundance is inside the species. Most of the indexes and the measures that have been provided, that have been suggested to estimate the evenness are just the original formula of the diversity for why the information of the richness has been removed. For instance, the Shannon evenness index is just the Shannon index divided by the logarithm of the number of species, so the logarithmal richness or total richness. It moves from a 0, it means minimum evenness, to 1, that’s maximum evenness.
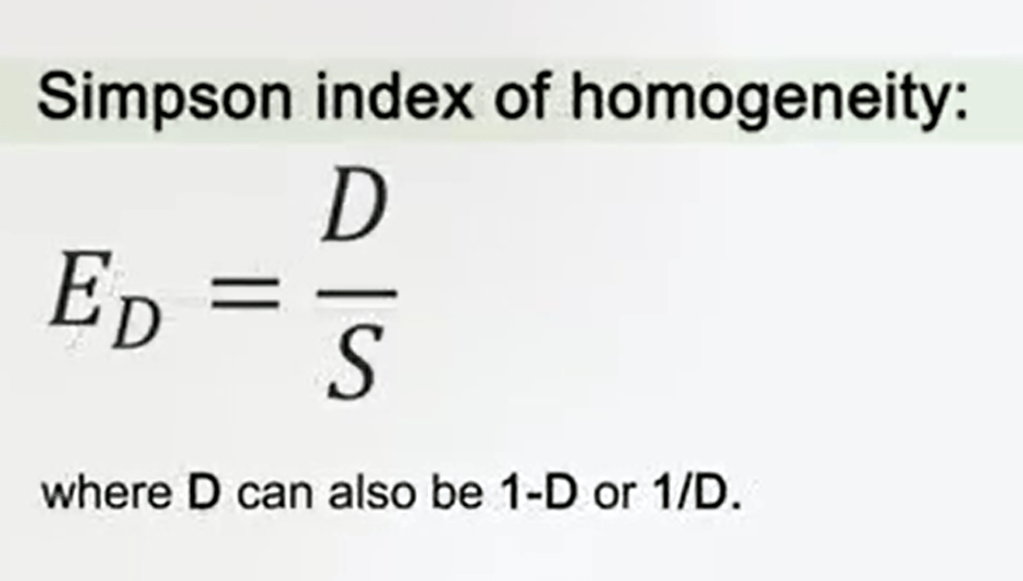
The Simpson index of homogeneity orevenness, has the same, just the Simpson index, divided by the simple number of species, the total number, so richness. So, you divided D by S.
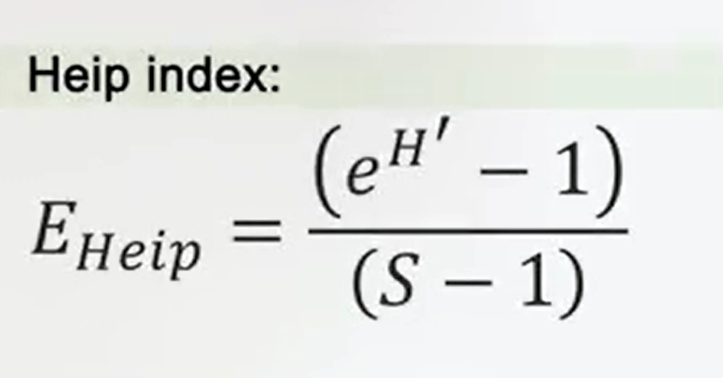
A modified version of the Shannon evenness index with less weight to the species richness so lower values when lower evenness, is the Heip index, it’s just the Shannon index, the exponential form of Shannon index -1 divided by the total number of species -1.
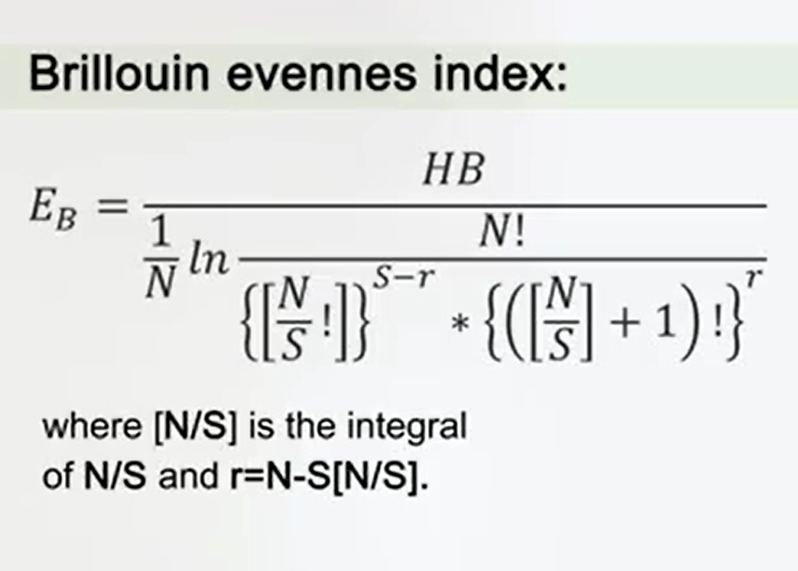
Another way to measure the evenness is the Brillouin evenness index. The Brillouin index is very useful in case of no random sampling, for instance when you are sampling parasites. The formula seems to be complicated, but you can use, in special cases it could provide very important and very reliable information.
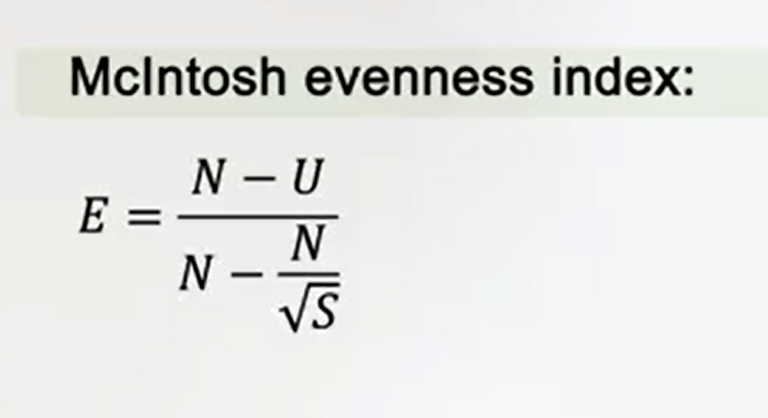
Another way is the Macintosh index. It comes from the Macintosh diversity index but in this case you divide by the total abundance minus the total abundance divided by the root square of the species’ richness.
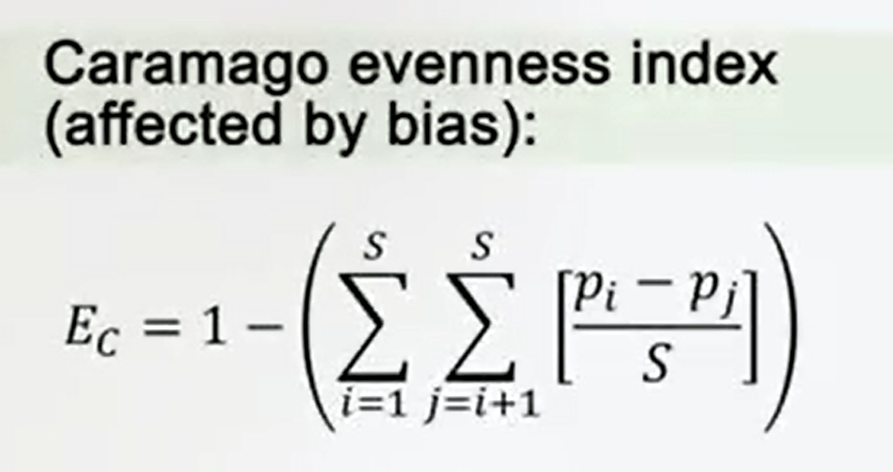
There is another index, but this is, I’ll just tell you, because of information that is effected by bias, it is the Caramago evenness index. This index has been suggested as a form to avoid the influence of dominant species, but as I told you, is affected by bias, so it’s not so reliable as the other one.
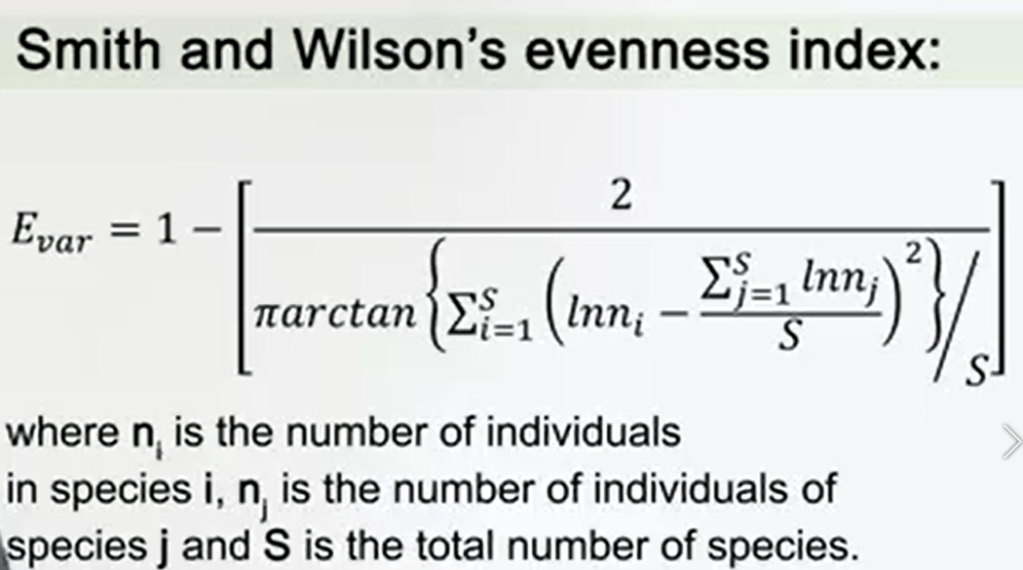
Smith and Wilson then developed a kind of evenness that is not affected by the unit measure, and then tried to summarize which measure of evenness should be utilized in a different case. So they suggest that if the symmetry between rare and abundant species, sothe importance of the abundant species and the importance of the rare species should be equal is requested. They also suggested a method to understand which measure of evenness should be utilized in different cases.
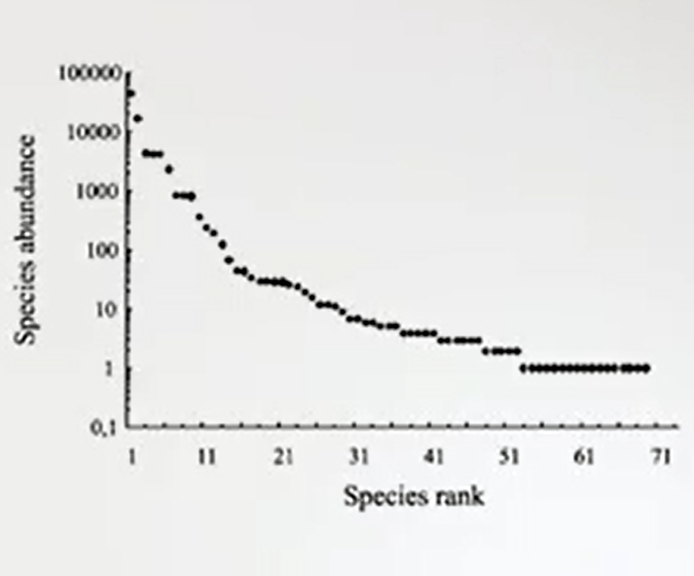
For instance, if the symmetry between rare and abundant species is request, you have to use Simpson index so the inverse index of Simpson if the minimal evenness should be 0. Or Camargo evenness index if intermediate values of evenness should correspond to value of the index. If you don’t need the symmetry, such as if the most common species have more importance than rare species, you can use this log b of the rank abundance plot that Iwill explain to you in next lecture. If you don’t needa response, otherwise you will use this. In any case, as also this measure suggested the Simpson evenness index performs always well. So it’s strongly recommended to use Simpson evenness index in most of the cases.
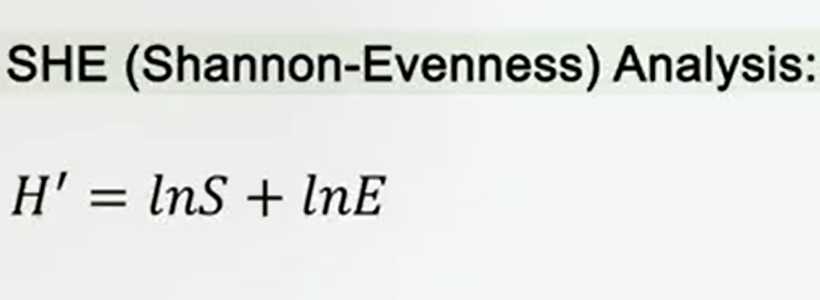
A useful and interesting way to analyze the behavior, or richness and evenness, so it means the behavior or the diversity is the SHE analysis that is Shannon-Evenness analysis. Shannon index can be considered as a combination of the logarithm of the evenness andthe logarithm of the species. For instance, the index is just the sum of logarithmic species plus logarithmic evenness.
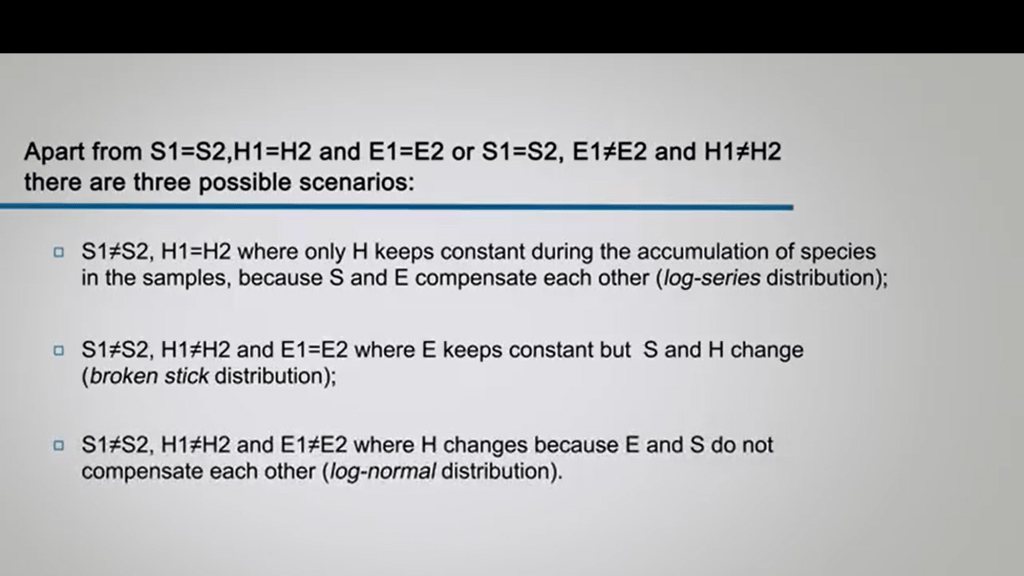
Why we want to compare two samples of the same sample after the treatment, for instance, pollution, different station, or others? We can, in some cases, In three possible scenarios. One is that the two richness are very different but the diversity of the two samples are equal. So where only H keeps constant duringthe accumulation of the species in the samples because the richness and evenness compensate each other. This is a kind of log-series distribution. There is a case when the richness of the two samples and the diversity of the two samples is diverse but the evenness is equal. And at the so the evenness keeps constant but the richness and so diversity change. This is a kind of distribution called broken stick. And there is the third case where everything is different between the two samples. It means richness is different, diversity is different, and of course evenness is different. And this is why diversity changes because evenness and richness do not compensate each other in this kind of distribution, log-normal distribution. When you put in a graph all the components of diversity, you will have a kind of representation like this that helps you to understand the diversity and the differences in diversity between two treatment, two samples or two areas. Next time, we will discuss about better diversity, understand how to measure it. So let’s see you next time. Goodbye.

Legg igjen en kommentar