Hi guys, welcome to the 11th lecture of my course, Biological Diversity Theories, Measure, and Data sampling techniques. Today I will explain you how to analyze, and measure biodiversity
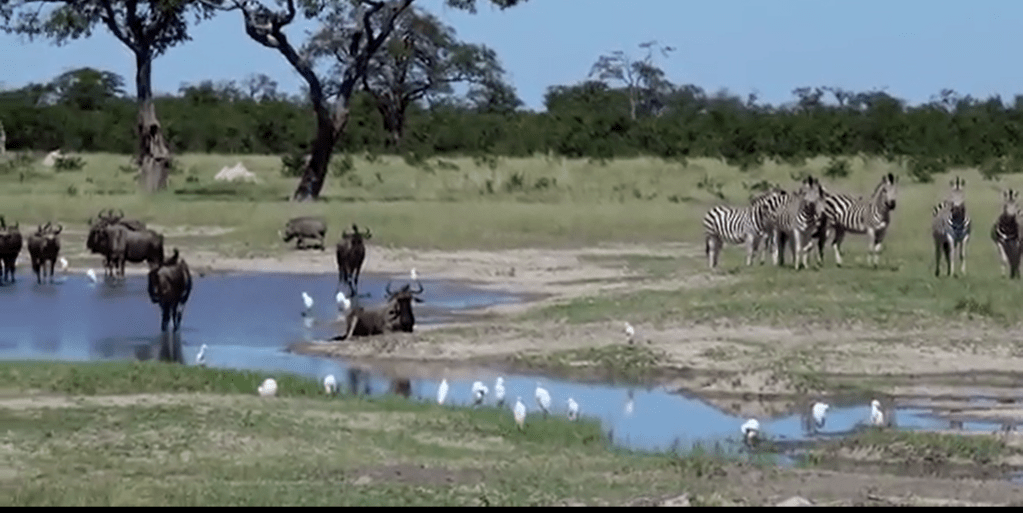
First of all, we need to start to understand what is a community. We have some different possibilities. One of them was proposed by Crabs in 1985. He said that a community is a group of population in a single place. Later Bagon and other authors in1986 proposed that the communities is just an assemblage of population which accrue together in space and time. We need to summarize this definition andwe can express just the community as a group of interacting population in a single time in a single definite place.
There are some implications of this definition. First of all, species in a community needs to interact with each other. This can include all species, so I mean the community can include all species or can be limited to a single guild. More common and more tractable, of course, because we reduce the number of species included. And a community can also be defined by a consistent special boundary. So definition of community depends so how we design the studies, and the sampling aimed as we want tounderst and and we want to calculate.
There are differentaspects of bio diversity. Before starting our research study, we need to ask ourselves what can we measure? There are different possibilities. We can measure richness of species, abundances of species, diversity that is a combination or relationship between richness and abundances. Guild, perfect structure, evolutionary diversity with each species diversity. Such as genetic morphological diversity, and other features.
Then we need to ask how to summarize anddescribe nature, because we got near infinitenumber of things to record. So we need to simplify. The simplification is dictated bythe experimental question, the location, the taxon, and he sample orreal the sub sample from nature. It depending on to choose an aspect of biodiversity, to choose a location, to choose a life stage etc.
The sampling effort is just the number of samples we need to collect to insure a correct sampling of the community. It depends on the economic resources we have available, the human resources, time and question to answer. It has been suggestedto kind of rule of ten. So it means that collectedly stem samples, plot, grades, etc, for each treatment would be enough, sufficientto provide a very good research study. Three, of course, is the magic minimal number in statistics, but is usually is a too low for ecology.
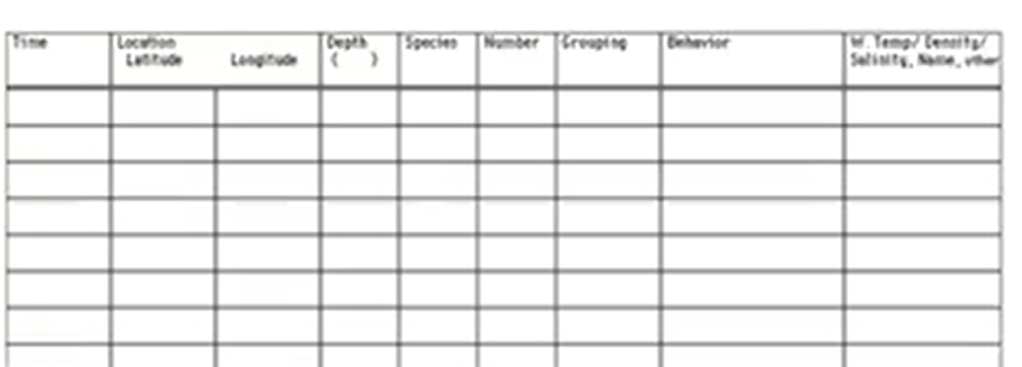
So how to sample the data? We need first to keep data separately because merger data cannotbe separated later. That’s very important point. If you look for viability,you need statistic. That’s the second very important point. But for doing statistic, if you merge raw data,you cannot perform any kind of statistic. So, for instance, if your sample builds per day, you need to take information on the hour. Otherwise, later, you can have this information but only together with day by day.

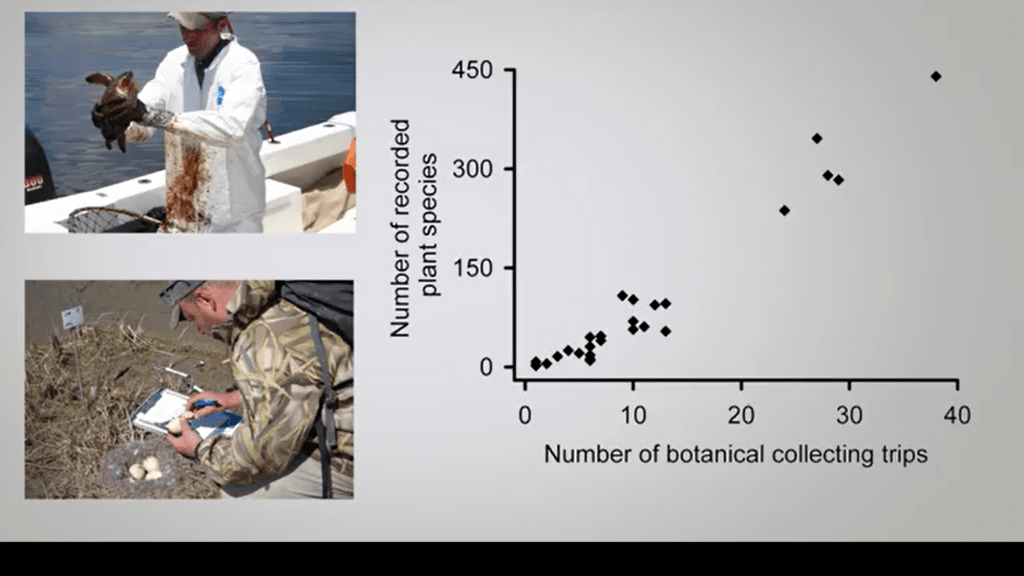
To sample diversity, you need to remember that less sample you get, more biases you of course you have. So biases is just systematical differetfrom the population parameter of interest. So it’s important to get increase the number of samples to approach the real numbers of species. If you are evaluating treatments, you need less samples, but if you are evaluating the total diversity, you need more samples.
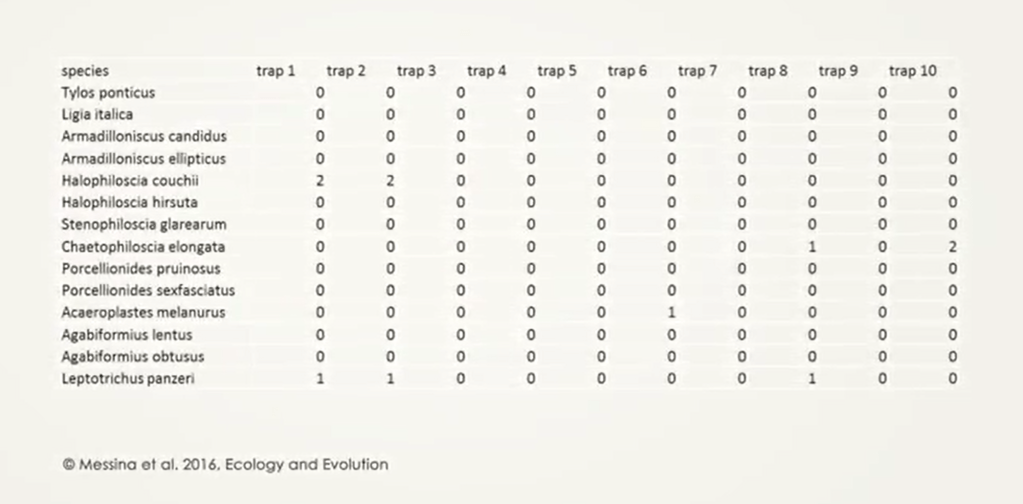
So how to compare communities based on samples? You need to use abundances. That’s the basic information foreach taxon for instances if you are collecting species,genes, family, etc. All for any operational taxonomic unit. Then you need to showthis biodiversity data. And tere are different ways to show. I will not explain in details now, because this is argument of next lecture. But I was just to introduce which system we have to explain and to show biodiversity data.
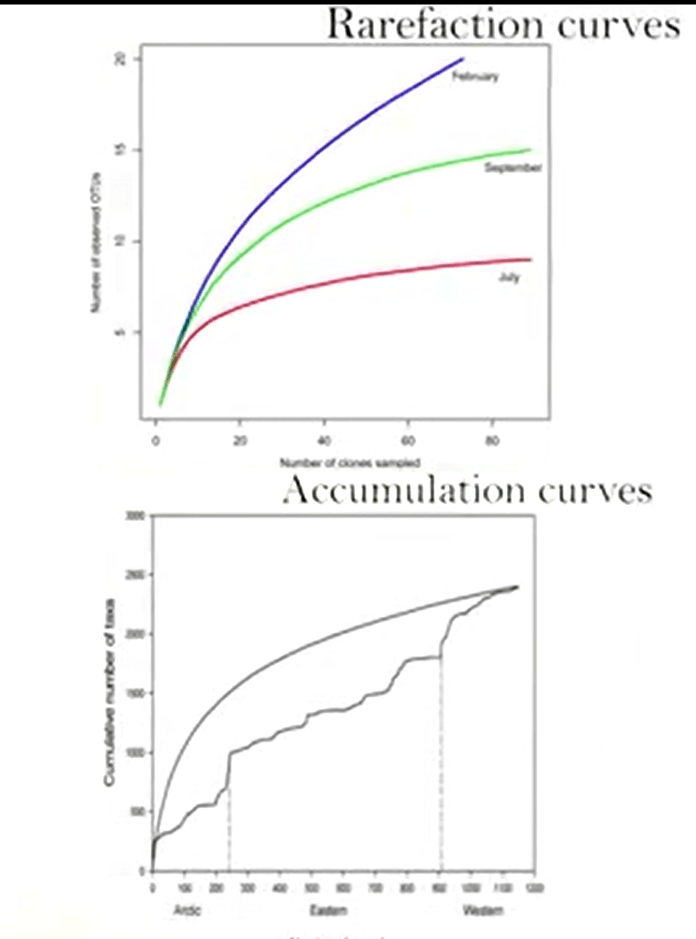
First is the rarefaction and accumulation curves. These curves just compare different samples each other, and makes information, and provide information how different are these samples to each other. And which one is the richest, which one is the poorest, etc.
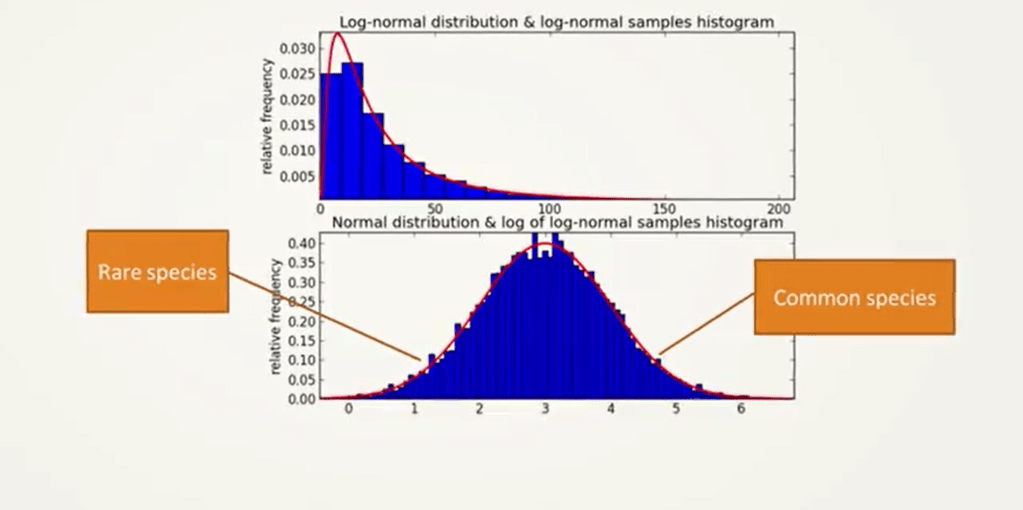
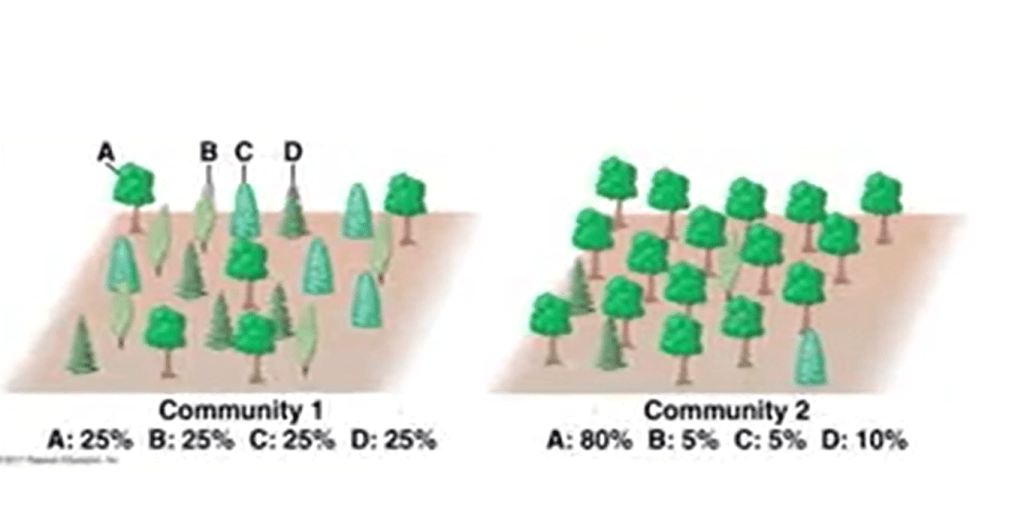
Another way is the log normal of distribution of data. We can have different distribution of our abundance per species, and these can be shifted on the left. It means that we are missing array of species. They can be balanced. So they can follow a log normal curve, it means that we have a good representation of common and rare species.
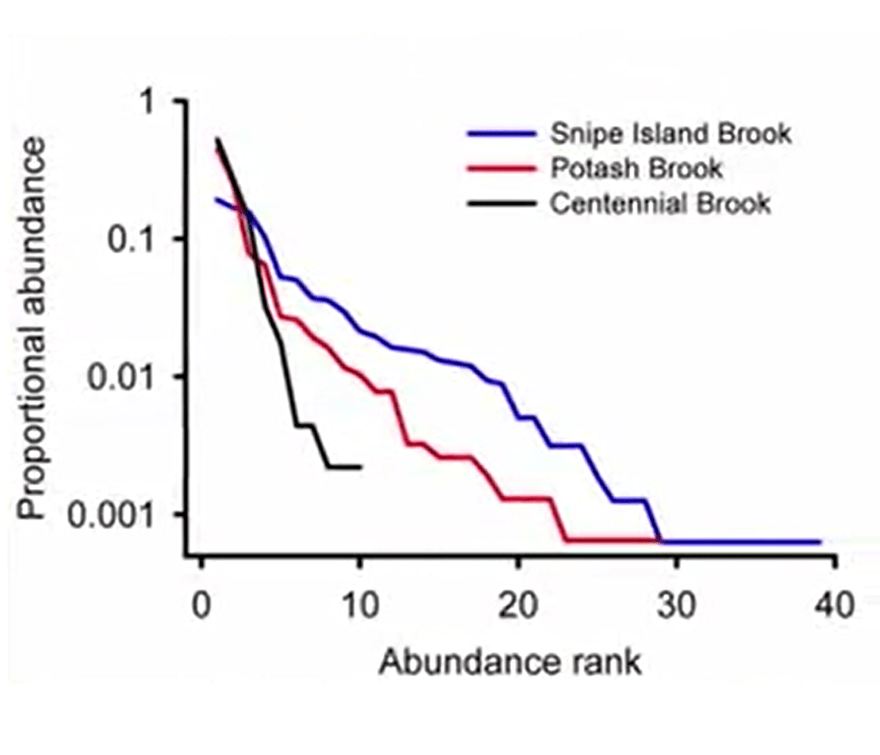
Another way to show biodiversity data is the rank abundance plot. The rank abundance plot is a plot that only shows the abundance ranks of species, and on the ordinate, the proportional abundance of species. And this is another way to compare different samples.
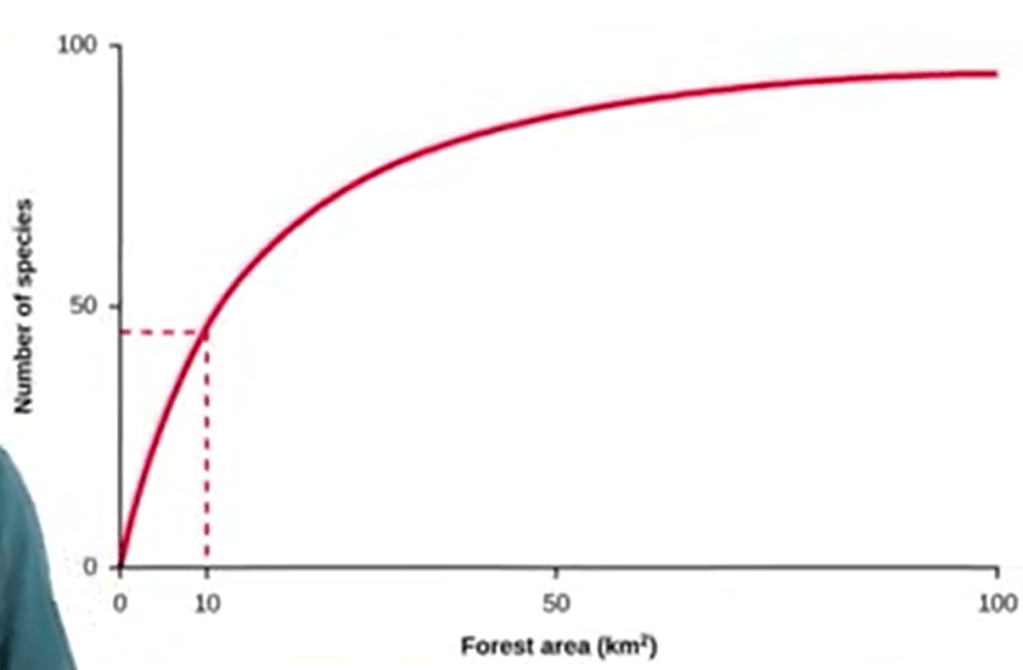
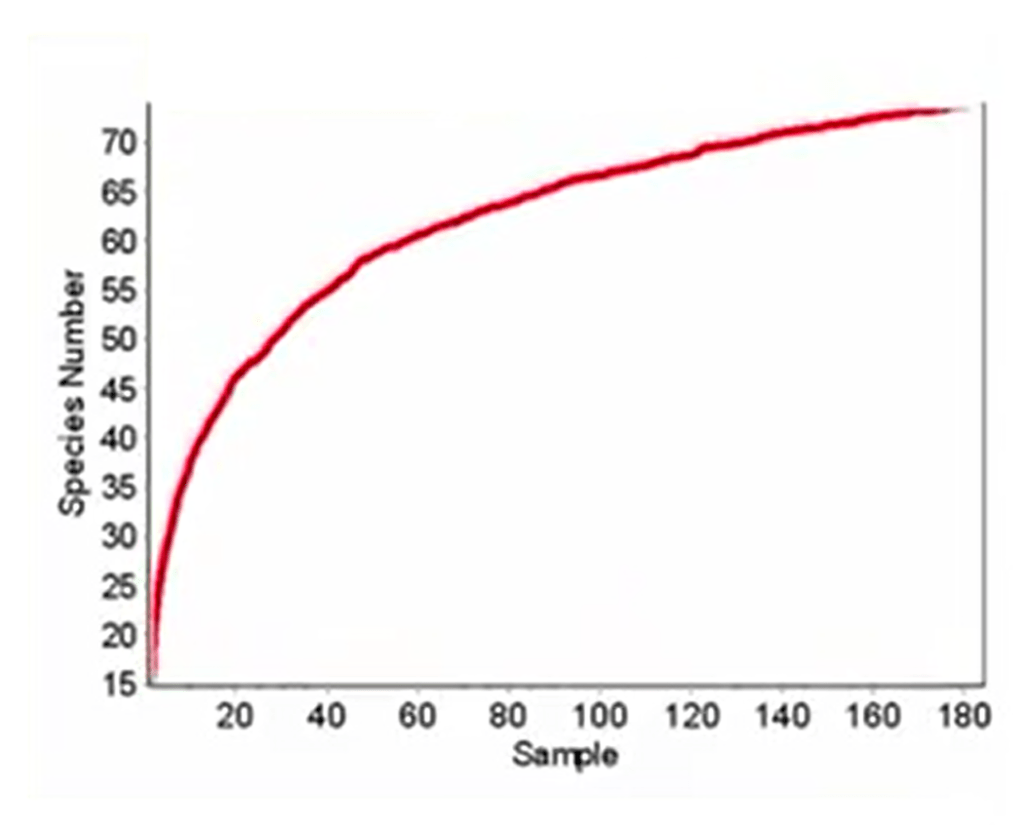
A very useful tool is the species area curves. These curves as the curves that representthe area sampled on the epsisal on the x-axis and on the epsinal axis represent the number of species. So, as soon as we get a kind of plateau, we can under hand when the sampling effort, the minimal sampling effort, is complete.
Today, I will continue to explainto you how to analyze and measure biological diversity. So, let’s continue discussing how to sample biological diversity. Of course, it is impossible to collect all species in a community. So our aim should be to collect the greatest number possible of individuals, sensor, or species. A general tape is that it’s better to collect many small samples than few big samples. Another important thing is to ensure to get right and permission to sample. For instance, you have to ask national park or protected areas authorities to be allowed to enter the park and tocollect your data for scientific purposes. You need to know statistic. That’s a very important point, and otherwise, if you don’t know, okay it’s better to know something. It’s better to learn how to carry statistic, but at least it’s important to know statistician. So, in order to sample biological diversity, we need to select the target community. And for doing this, we need to chose the sampling frame.
The sampling frame is just the range of the sampling that can be a political or geological or a administrative boundary. And we always need to specify in our papers, in our research report the sampling frame.
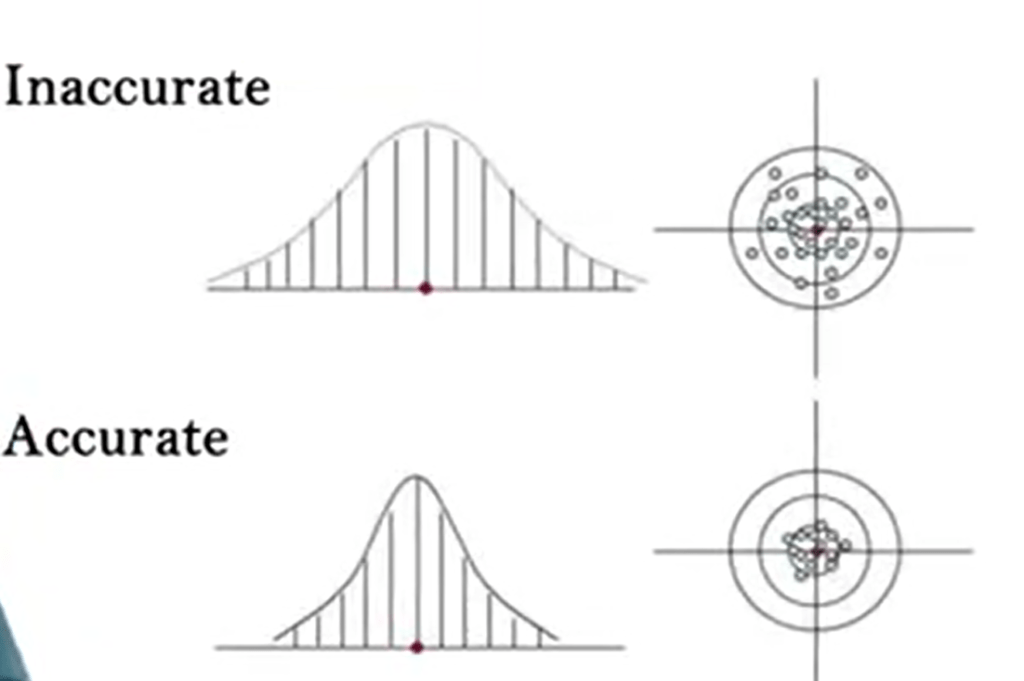
When sampling biological diversity, it’s very important to mind the accuracy. Accuracy is the function of the bias and the sampling error. Also, of course, we need to mind the bias.
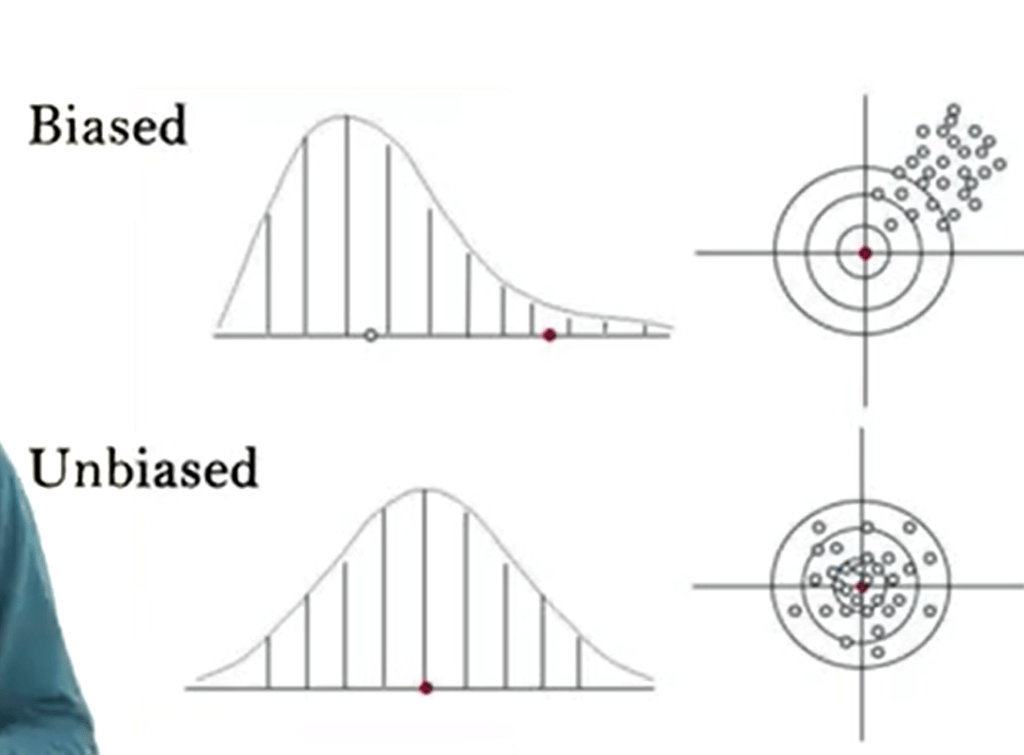
Also, of course, we need to mind the bias. We have two different types of bias. Measurement bias and sampling bias. To reduce the bias we need to increase thenumber of samples and to vary the sampling technique, for instance, just increasing the number of leeches.
So, we need to mind the sampling error. Sampling error can be detected unlike bias, measured and quantified and reported into the papers as a standard deviation, error standard, etc.
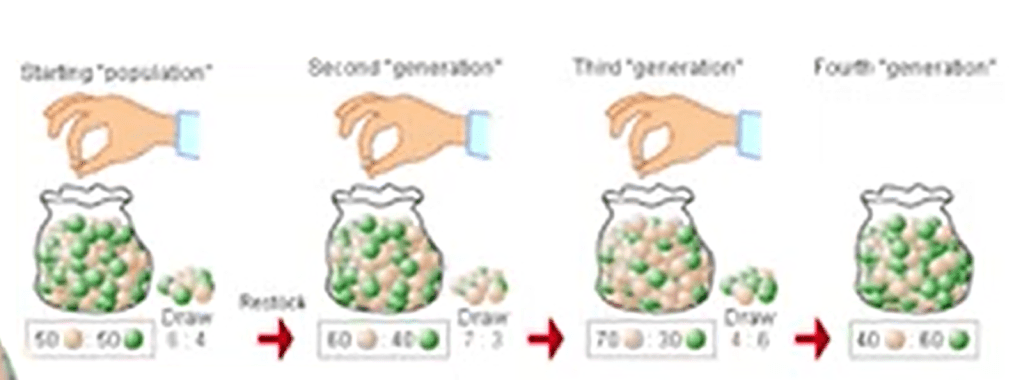
Sampling error is kind of equivalent to genetic drift in evolution, I’ve explained to you, when you’re starting to sample populations, then you draw, and then you stop and draw and stop again, and you have the ratio that is changing from the beginning.
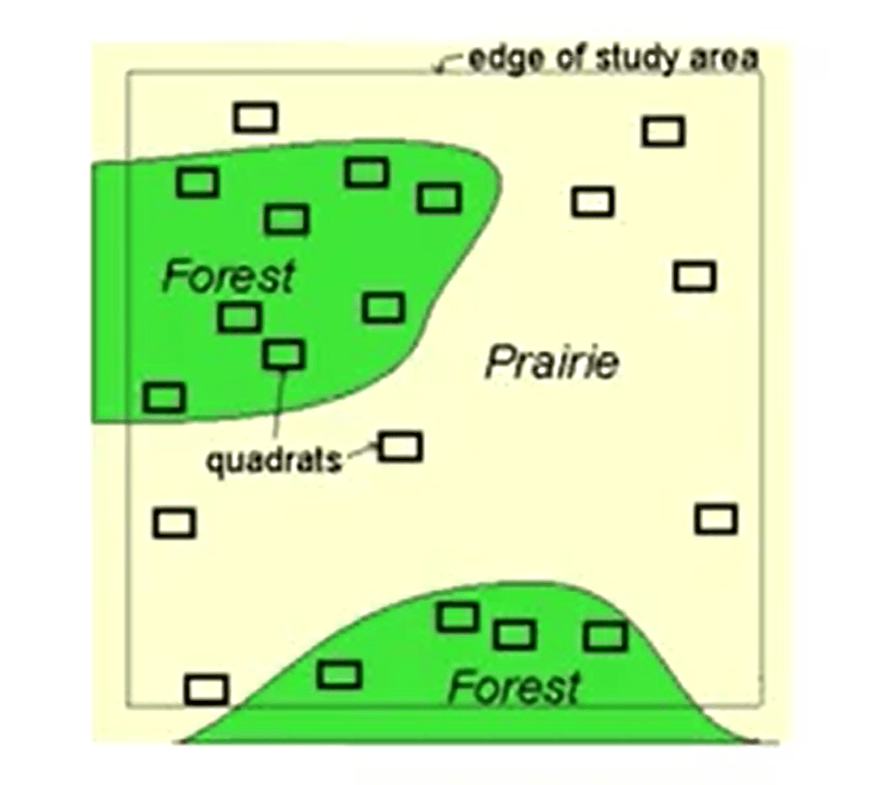
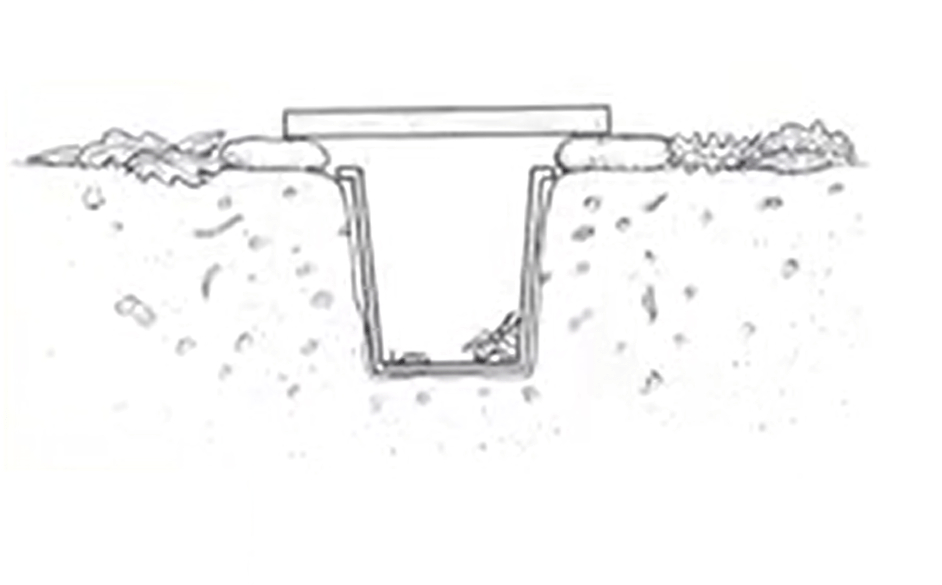
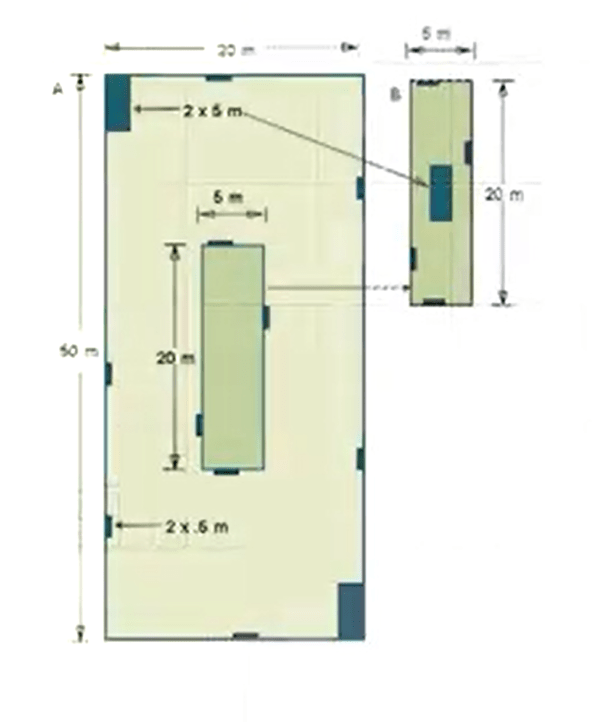
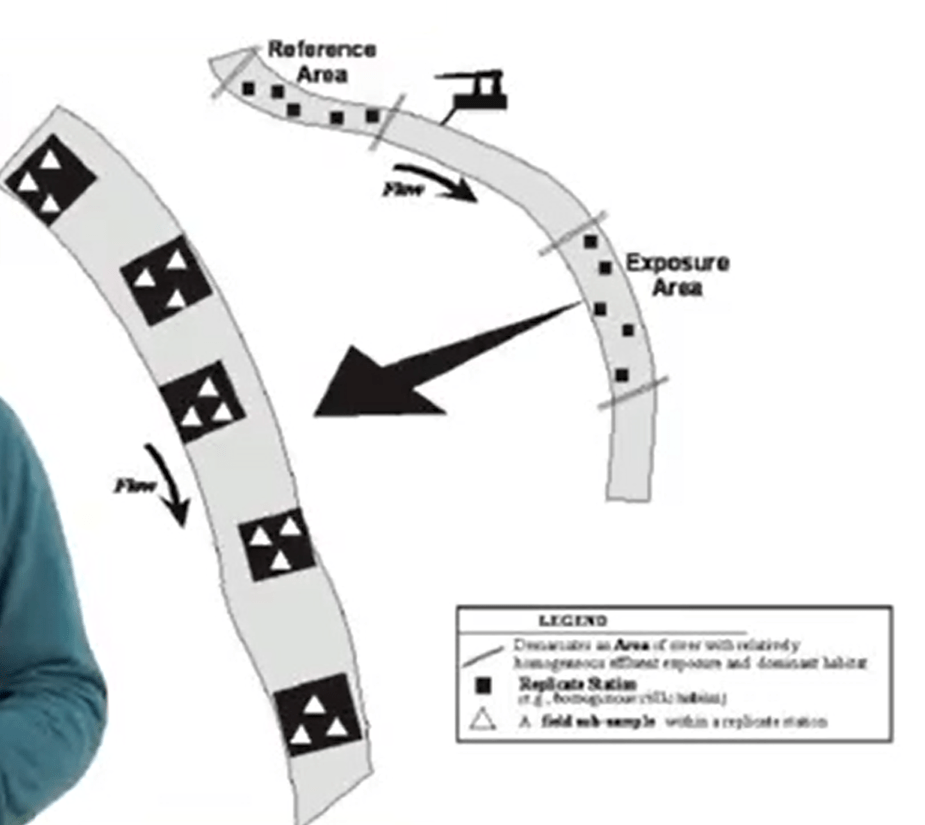
Then we need to select the sampling unit. A sampling unit is a square plot, a circleplot, a plot of grid or something else. Choosing between design is a key questionin biological diversity sampling. So, how to choose betweenthe sampling areas? It depends on the experimental question. For instance, if we are working in gradients, probably the best is to use trisects.
Or in this case, ensure the compatibility of different sample techniques. If you are walking in relative uniform sampling area, we probably need to random our sampling soif done frequently enough. We need to get equal representation of our areas that are included.
We may use green, that are very useful when need to uniform samples in the area. Green can be a good choice when we need to use a regular intervals along two dimensional design.
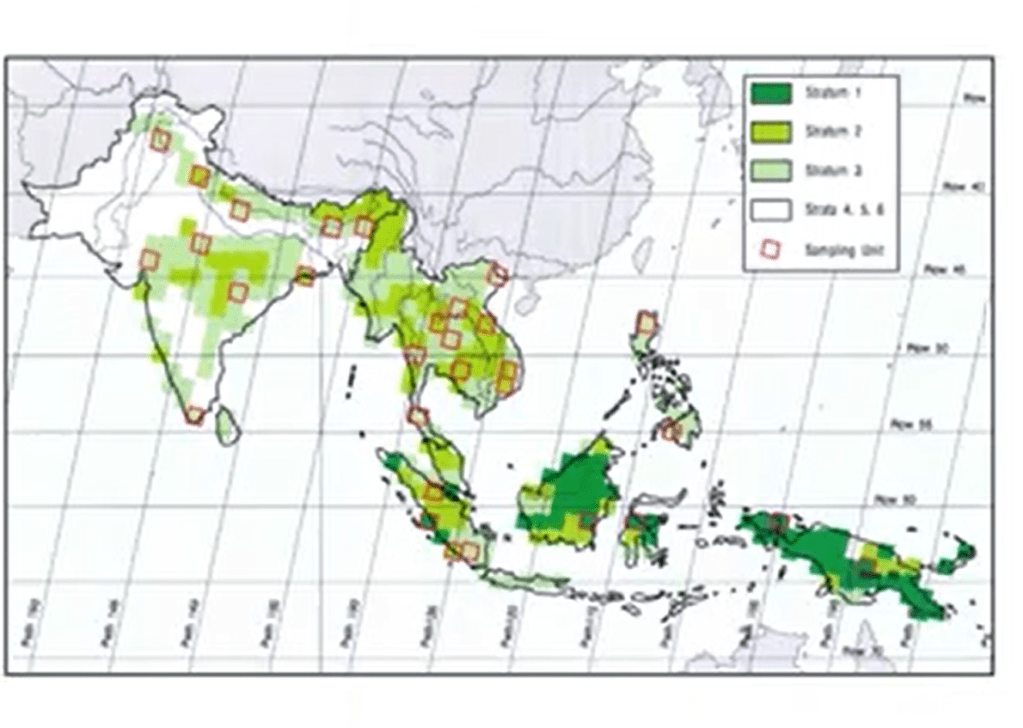
Transect are very useful, instead, when you have to sample with reference to a straight line. Random sampling can be used to sidepoint quadrants, quadrants, or other sampling methods. There are other types of stratified sampling, for instance, as a very important condition that every element of the population must be presented in only one stratified layer.
We have different citing techniques. In short, a citing technique is justany viable form of collecting samples. So, we need to be cited at the level appropriate to the question. For example, We can use point quarter in the proximity to a central point within a cross. We need to use product if just sampling within a small area. We can use pitfall traps. We can use beetle sheets, we can use meat snack things, seining, etc.
One of the most used sampling technique in plant survey are plots. Plots can be of different types, can be nested, can be winded course plots. It depends on the sampling that we are going to organize.
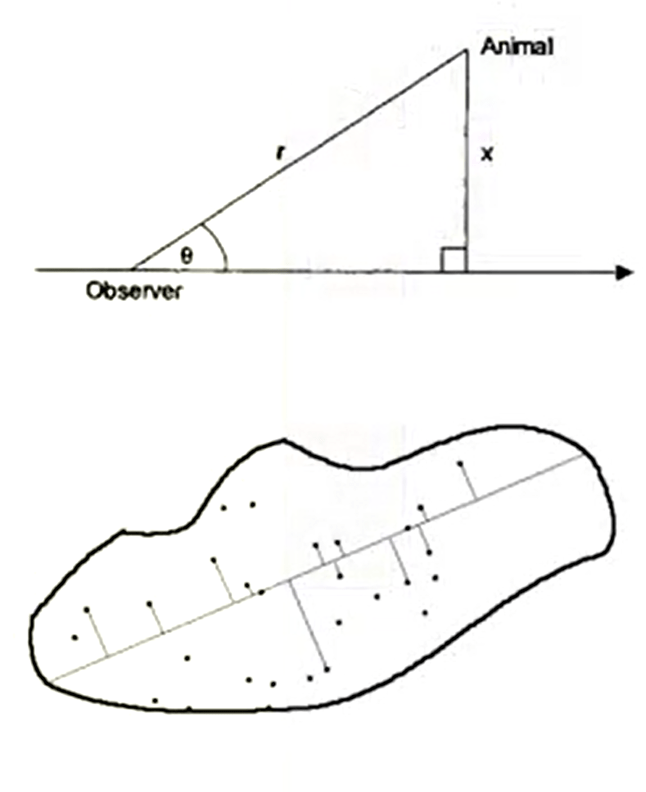
In animal survey for instance it’s very important to understand how to work distant sampling technique.
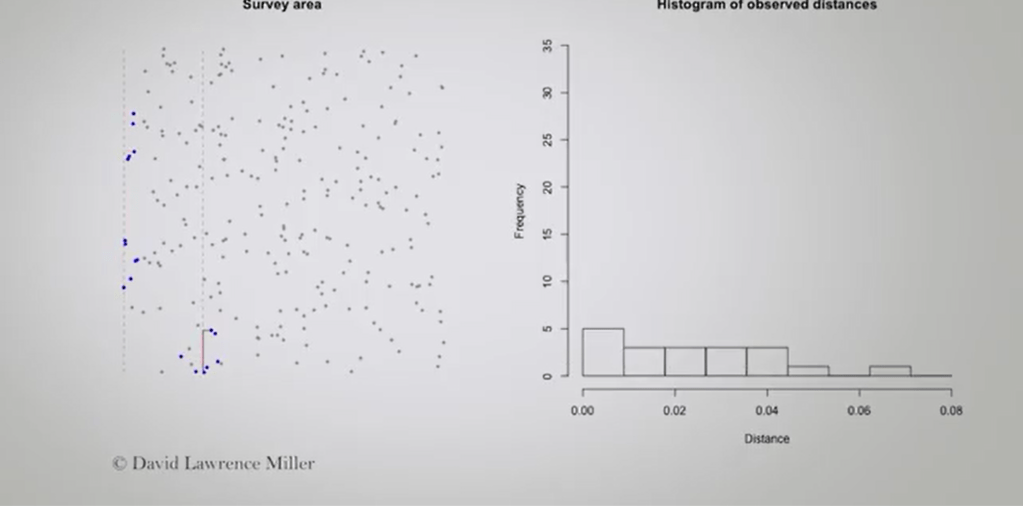
In this case, we just note the distance from our object from the angle we spotted, and the angle from our line, that is a for instance, and the animal we spotted. That’s very useful, because we can construct a kind of histogram in this way, and use this histogram to estimate the number of animals that are in the area.
Another key aspect of biological diversity sampling is replication. Why we need to replicate? We need to replicate because we need tocontrol for random and stochastic error. For instance, I’m testing the independent factor that may otherwise determine the outcome of the experiment. We need to increasethe precision of our test. We need to increase the generalizability of the test. So, if you test across many sites youcan safely generalize too many others.
We have differentdefinition of replicates. For instance, to consider a sample a truereplicate we need to maximize these in our experimental design. The greatest number possible, of course, but given logistical limitation. So if you are very professional in what we are doing, we need to use a power analysis. Otherwise, the sub samplecan be absurd to replicate. It means that this is onlytrue if the sub samples are incorrectly treated as true replicates for statistical analysis. So, sub samples are useful to increase the accuracy of the data estimate for the replicate. A special type of statistics analysis are therefore possible. So cellular replication is due to incorrect replication, for instance when we are replicating samples and not treatments, or when we replicate without independence. So the problem, the main problemthe problem is that this violates the key assumption of statistical analysis. So, for instance, the independence replicates, we need to increase the precision of studies if independent. We need to approximate through If vital if they are independent. We need to account fornormal random error. We need to allow to set our key factor such us alpha factor and keep it constant. And all of these are violated if our samples are replicated
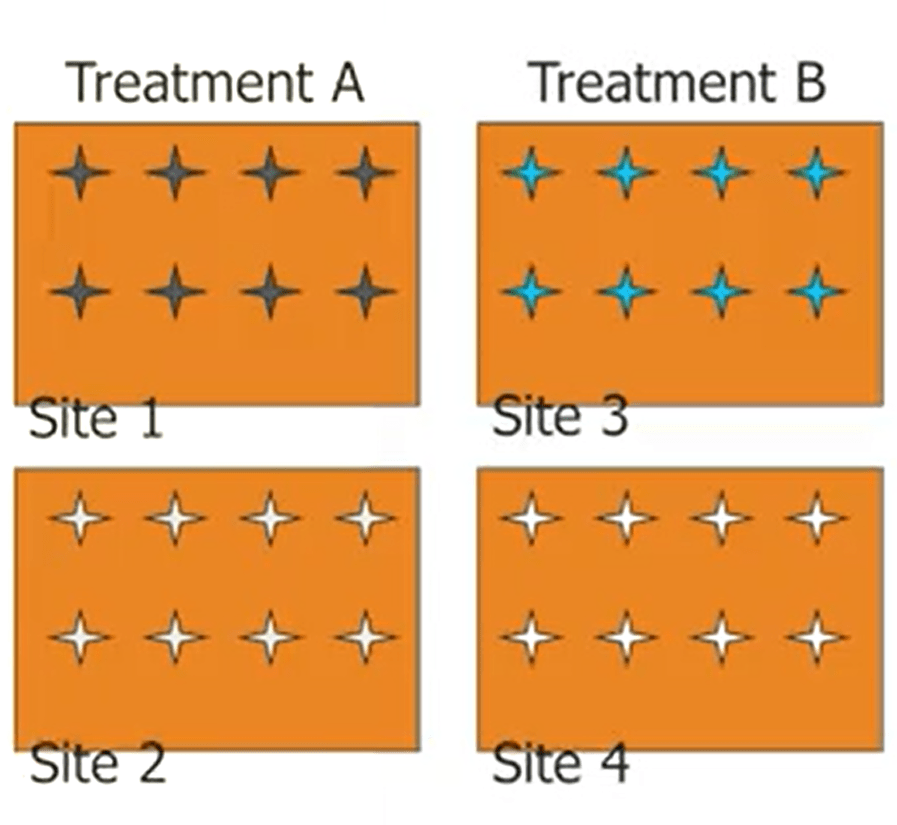
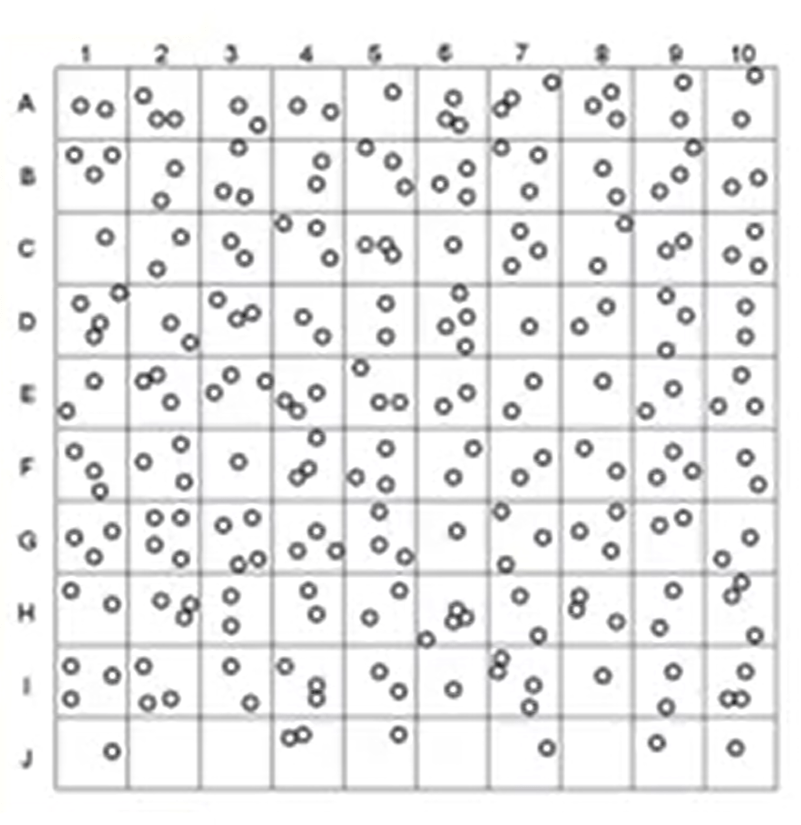
I’ll provide you an example. For instance, we have two treatments, the question is what is the effectof Treatment A and Treatment B? If we do cellular replication, we treat each stock inside the square, that’s our sample of the same color as a replicate. If we do the right replication, we include only a single star of each color or their average. It’s very interesting to notice that almost 48% according to cellular replication. And 71% of studies that are using ANOVA, that’s a common statistical test anddesign errors. So this is important because particularly in studies with logistic problems for instance for animals for transportation or foreign as a limitation. But most of these studies are already in print.
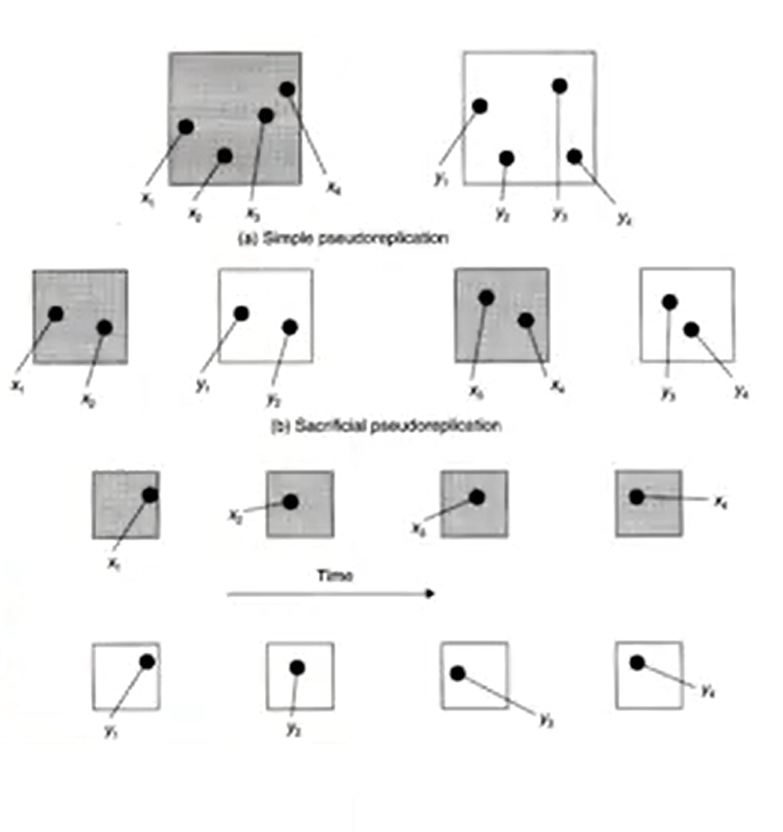
Some examples of cellular replication, when we have many samples from a singleside, these are actually sub sample, only a single foreach treatment condition. These are actually replicas, but we cannot use statistics on a sample size of one, or single samples from a single side, but replicating time would be true samples if the experimental question is time dependant. Vice versa, it just cellular the replication. So how to control of cellular replication. We need to know our question. Question that time whether the designincludes cellular replication. If we are working on taxonomy levels different from we are working on ecological level. So, we clearly need to define our independent and dependant variables. So, we identify what is the true unit of repetition, is very important for them that are the level of replication that are needed for ecological studies. So, we need to randomize our sampling design. This kind of randomization allowsus to decrease sampling error and to increase the accuracy of estimation. There is a kind of stoppage rule on how many samples we should take for a good study. Someone suggested that we need to stop at the reference point, that we can get from literature,for instance. Some others suggested that we need to stopat the sample gathered from a statistical distribution of a ranked abundance plot. Another option is to select the minimal sampling area from the species area curve. Or to estimate the samples number from the Chow, Alpha Fisher, or other indices. So I hope that information that I provided you on how to analyze and measure biodiversity will help you to fulfill the tests that are included in this course.

Legg igjen en kommentar