Hi, guys. Welcome to the eighth lecture ofmy course, biodiversity, theories, measure and data sampling techniques. Today I will explain you what are the causes of biodiversity decline.

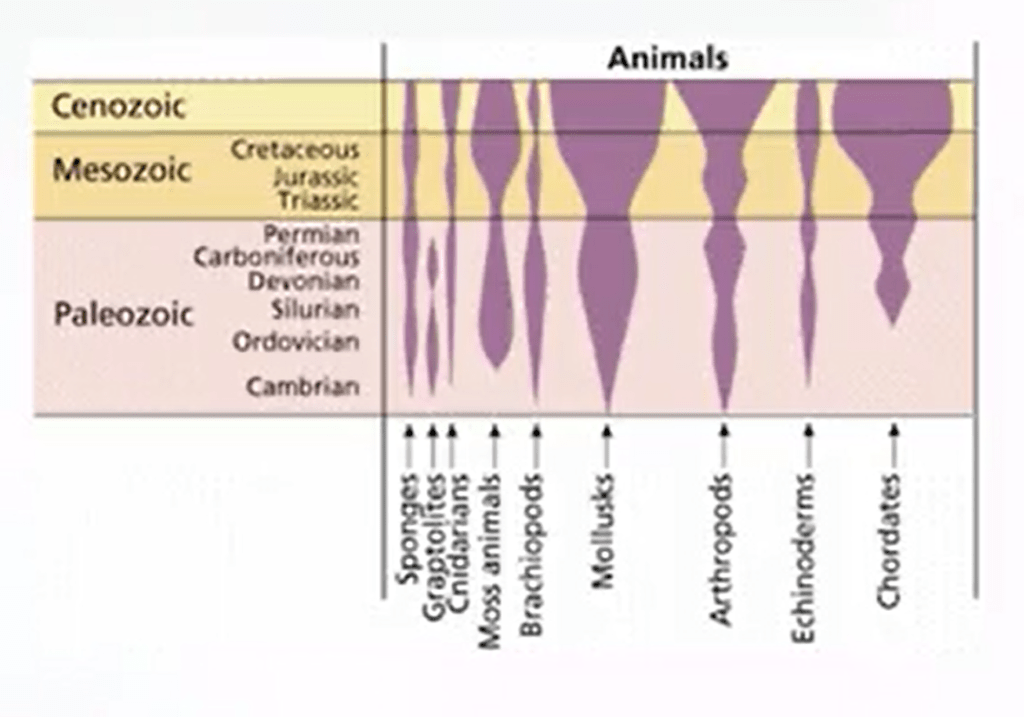
We need to understand the relation between biodiversity and extinctions. The Phanerozoic is the current geologicaleon in the geological time scale, and the one during which abundant animal and plant life has existed. It covers 541 million years to the present. The time span of Phanerozoic includes the rapid emergence of a number of animal Phila. The evolution of these Phila into diverse forms. The emergence and development of complex plants, the evolution of fish, the emergence of insects and tetrapods, and the development of modern.
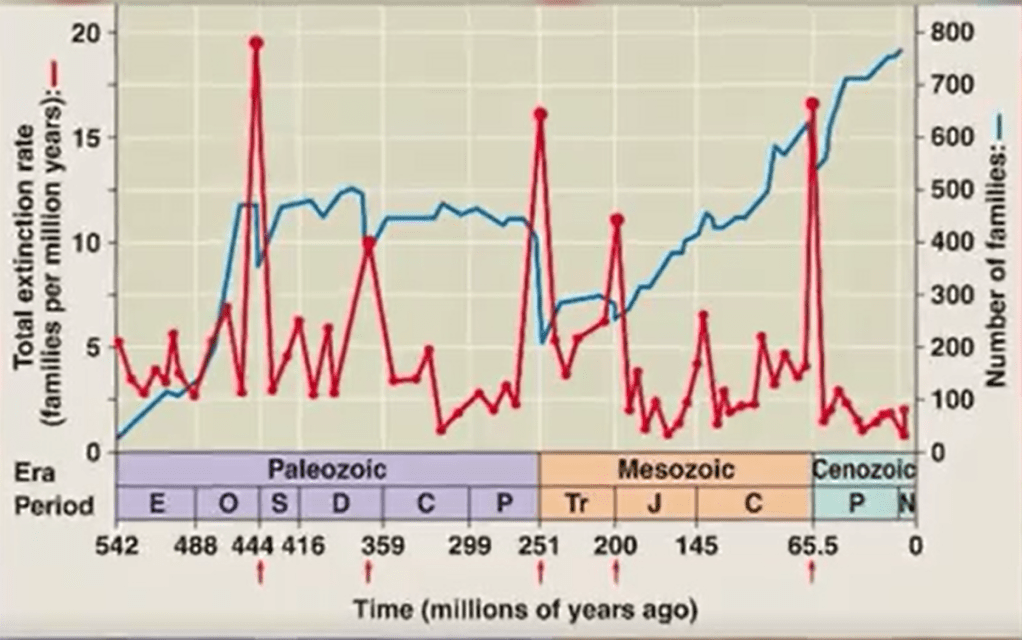
This graph shows the apparent percentage not the absolute number of marine animal general becoming extinct during any given time interval. You will see this in the red line. The blue line is the increasing number of species along time. The red line does notre present all marine species just those that are readily fossilized
During the Phanerozoic, biodiversity shows us but not monotonic increase from nearzero to several thousand of genre.
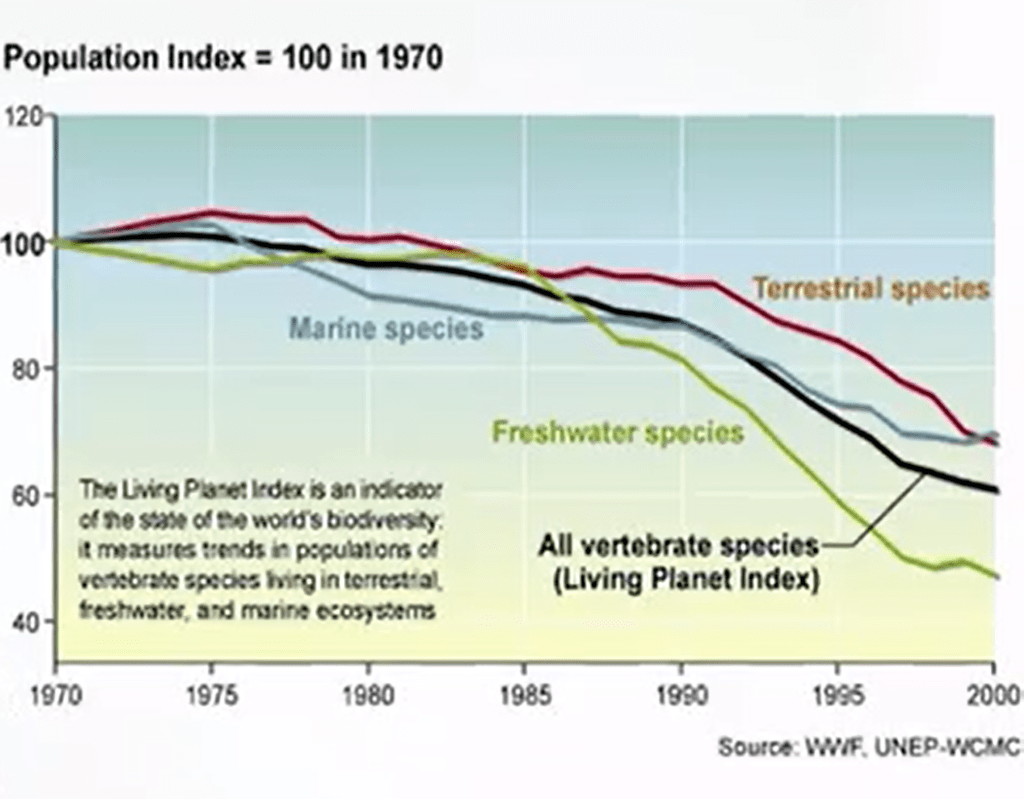
The living planet index isa good way to understand the trends of population of modern era. It is a measure of the state ofthe world’s biological diversity based on the population trends ofvertebrate species from terrestrial, fresh water, and marina animals. The living plant indexis trends of thousands of population time series collected from moderate sides around the world.
The global LPI as presented inthe living planet report 2014 shows that a subset of 10,308 population of 3,038 species as the client buy 52% inabundance between 1970 and 2010. The global trend can be further subdivided to show that while the clients have looked already in both temperate andtropical systems, there are more pronounced in the later 56% versus 36%. Trends also different inthe different ecosystem. With terrestrial and marine system declining by 39% and fresh water being reduced to less than a quarter of their abundance in 1970.

Human beings are currently coursing the greatest mass extinction of species since the extinction of dinosaurs 65 million years ago. At raise from 1,000 to 10,000time faster than normal.
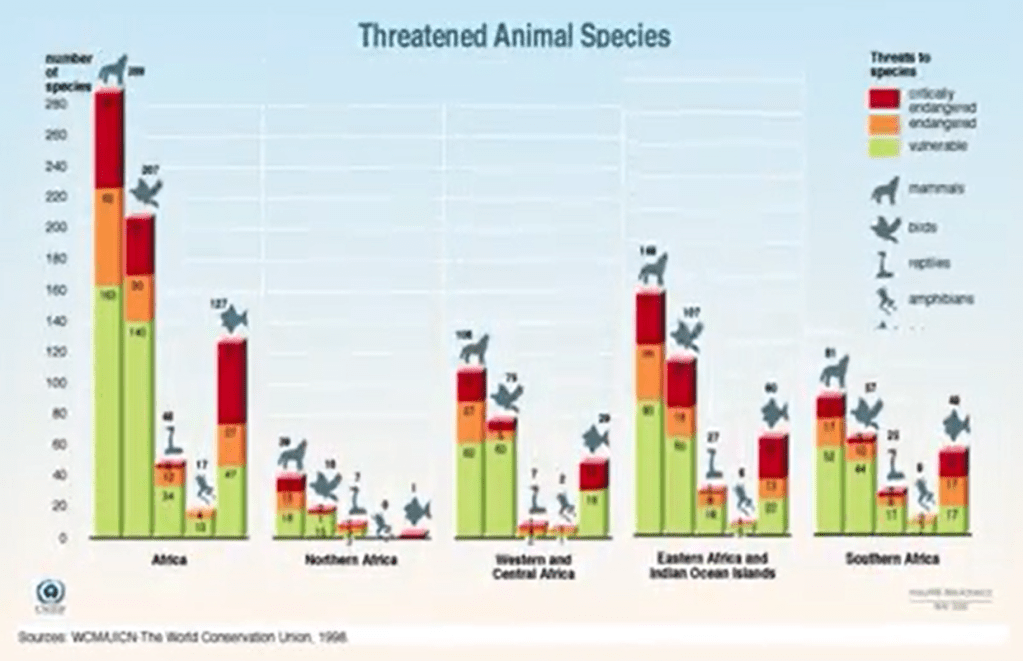
The 2014 living planet report which is the world’s leading science based analysis of the heart of our planet andthe impact of human activity states that 52% of all animals have been wiped out in 40 years. The last update of the IUCN Species showed that of 64,000 species examined worldwide, almost 20,000 are treated by extinction. Nearly a third of the total including 41% of amphibian species, 33% of reef building corals,30% of conifers, 25% of mammals and 13% of birds, and one-fifth of plant species.
We are now losing between 1 and10% of biodiversity per decade. Compared to the natural background rate of one extinction per million species per year we are now losing 30,000 species per year or three species per hour, which isfaster than new species can evolve. We can evaluate biodiversity losses, the species abundance before human impacts.
Look at this figure taken from the book Dead Planet, Living Planet. Biodiversity and Ecosystem Restoration for sustainable Development.
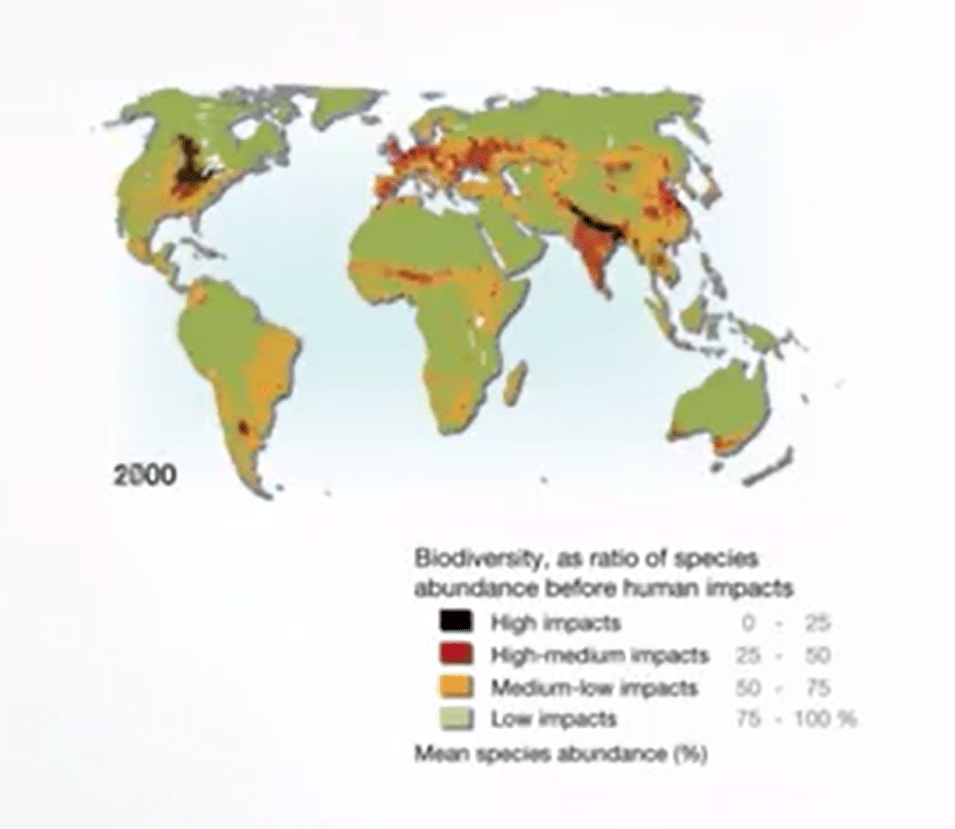
You can see that biodiversity can beconsidered as a ratio of species abundance before human impact. Despite this crucial rule for providing ecosystem services, agriculture and particularly pasture remains the largest driver of genetic erosion, species lost and conversion of natura
l habitats. Most global scenario project increase land for animal crops and grassing.
Our reducing crop and pasture land can only be achieve if drastic change in diets are assuming.
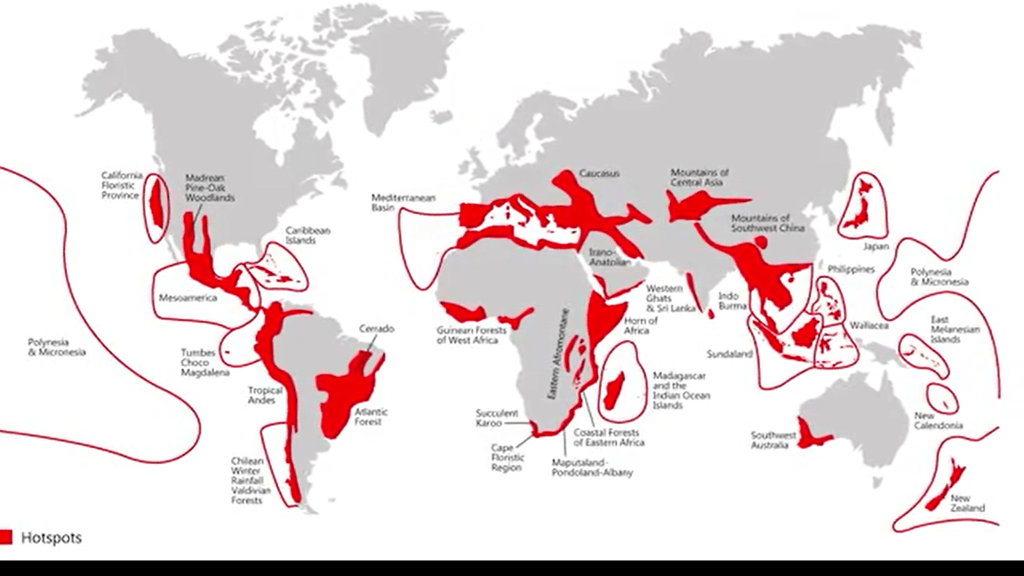
During the last lecture I told you about hots pots. This time I want to explain you in more detail what that means. Certain areas have a large number of endemic species, those found nowhere else. Many of these are early treated by habitat loss or other human activities. These areas are the biodiversity hotspot. 35 regions while success in conserving species can have an enormous impact insecuring our global biodiversity.
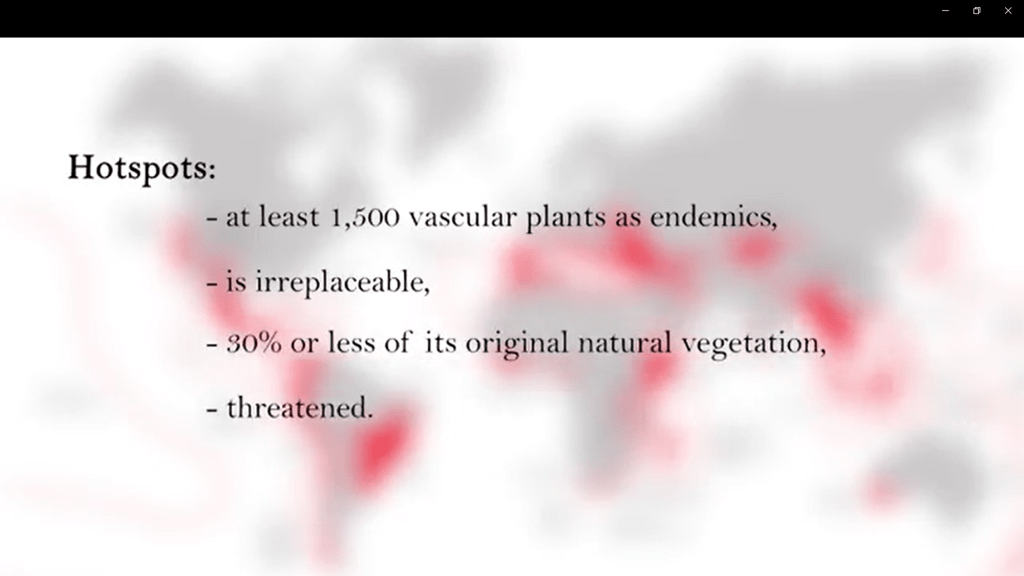
To quantify as a biodiversity hotspot, ourregion must meet two straight criteria. It must have at least 1,500 vascularplants as endemics, which is to say it must have high percentage of plantlife, found no where else on the planet. A hotspot in other words is irreplaceable. It must have 30% orless of its original natural vegetation. In other words it must be threatened.
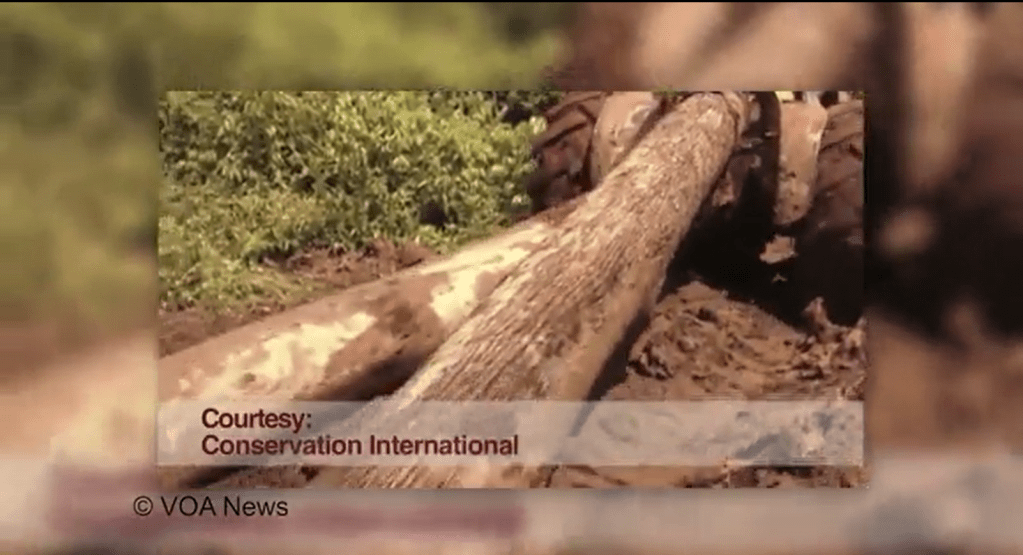
An important consideration in understanding why we are losing biodiversity is to consider forest management. Deforestation is well known to have serious negative consequences for biodiversity, and the balance of atmospheric greenhouse gases.

During my previous research studies, we compared field data from 511 plants in the tropical forests of Sierra Leone, Ghana, Cameroon and Gabon. This plants was subject to different forest management practice. Our findings suggest that the vertical structure in plant richness of the selected logged in secondary forest, changed in different amplitude from those of primary forest. Selective logging unless it is practicedat a very low harvest intensities can significantly reduce the biomass of a tropical forest for many decades.
Seriously diminishing the both ground carbon storage capacity and create opportunities for weeds and wines to spread as lowdown ecological successions.
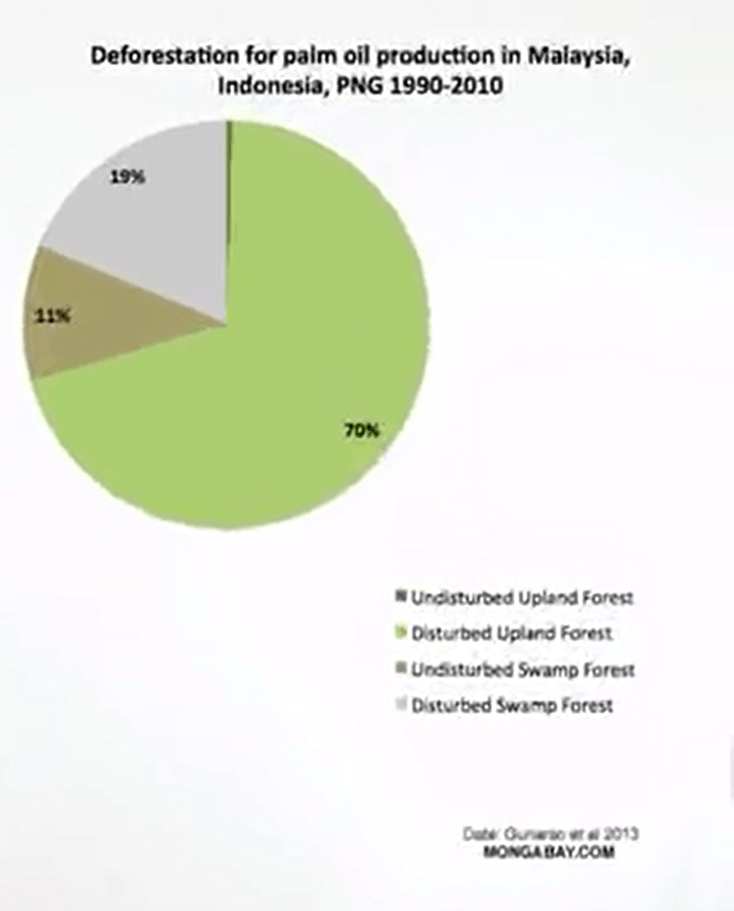
New studies also reveals that oil palmplantation established on primary or secondary forest are unsuitable habitats for the majority of forest wildling and active species. Our finding that indicates that biodiversity may be compromised. We see our adoption of biodiversity in different plantations. For example, nearly 80 mammal speciesare found in Malaysian primary forest.
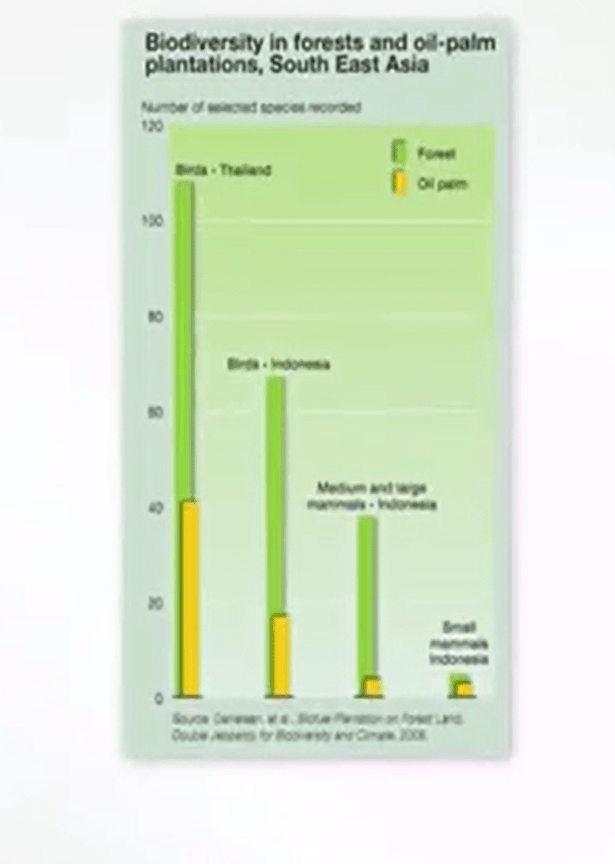
In contrast the Starbord foresthave just over 30 mammal species, while old plantation have only 11 or 12. Similar species are the optional core forinsects, birds, reptiles and some microorganism.
The tropical low land and high land forest of Borneo including vast expanses of rain forest have decreased rapidly afterthe end of the second world war. Forests are burned, logged, and cleared, and commonly replaced with agricultural land, built up areas, and palm plantations. These areas represent habitat forspecies such as orangutan and elephants.
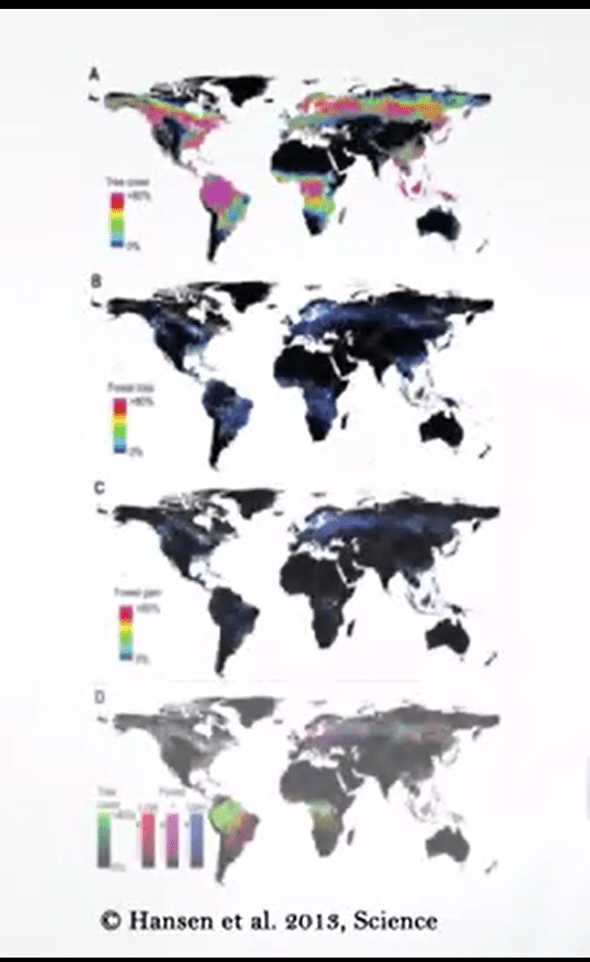
In this figure, there isa representation of tree cover, A. Forest lost, part B, and forest gained, part C. This is a color composite of tree cover in green, forest lost in red, forest gained in blue, and forest lost and gained in magenta, as shown in figure D. With loss and gain enhanced for improved visualization.
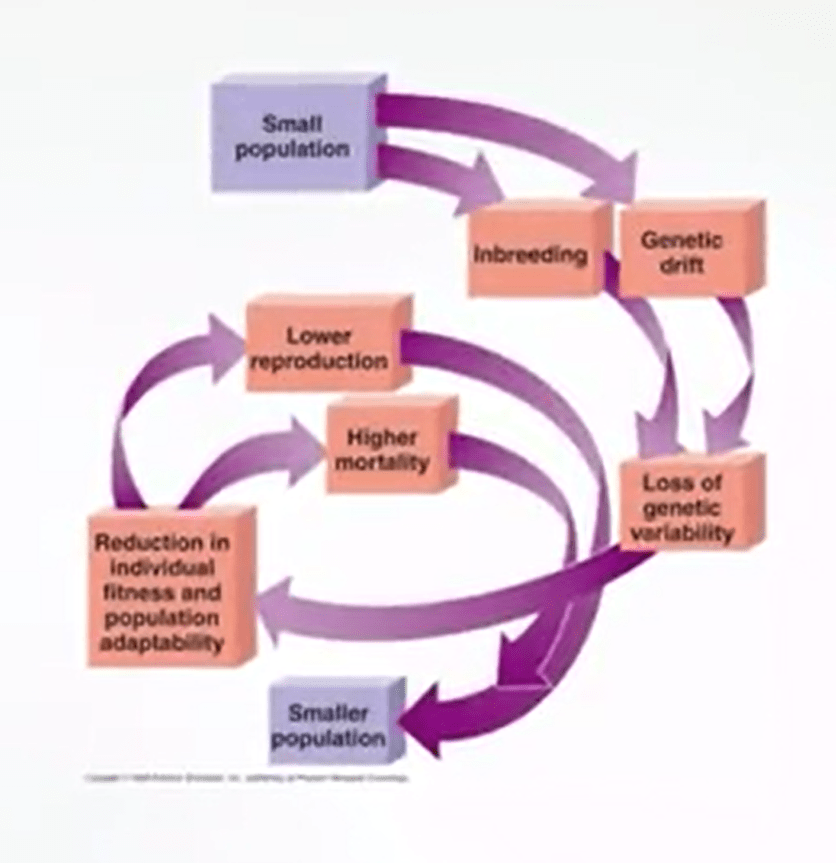
So why do we see this hugeamount of species loss? This is because we have an effect that is called extinction vortex. The extinction vortex is the term use to describe the process that declining population undergo when a mutual reinforcement or course among biotic and abiotic processes that drives the population side downward to extinction.
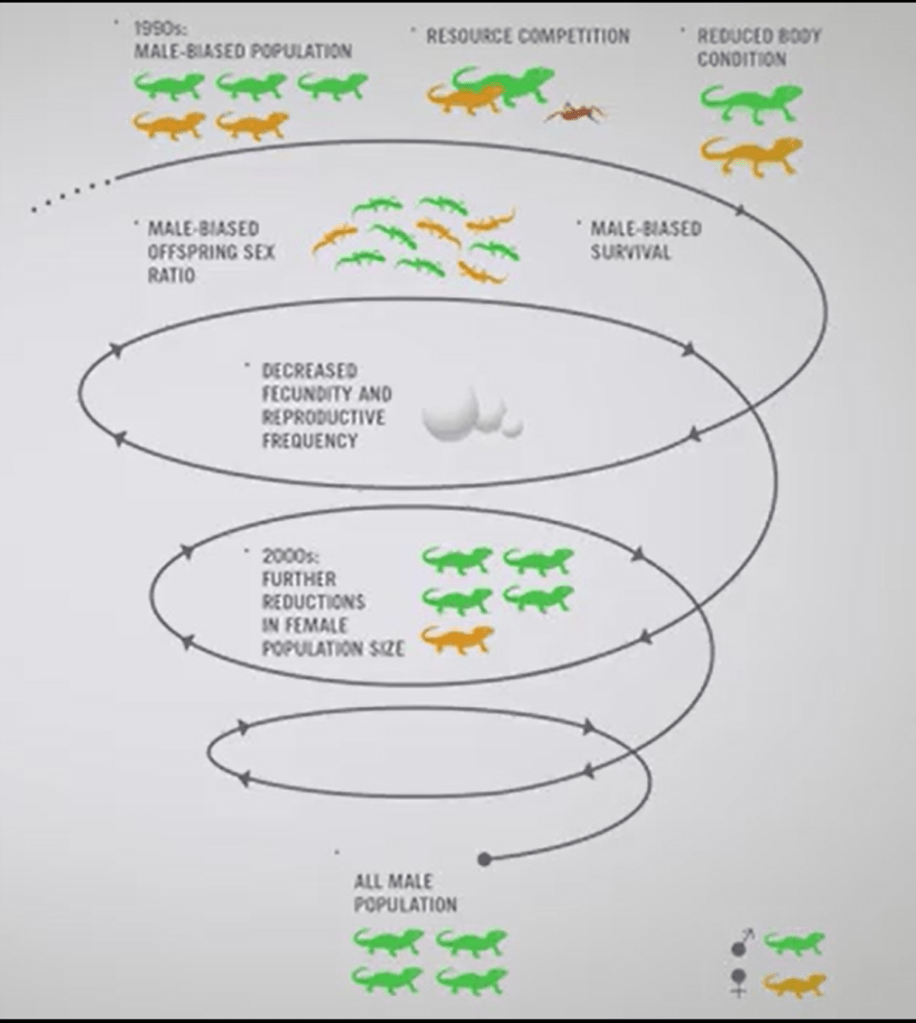
As a population decline, the time elapsing before extinction occurs becomes rapidly exponentially smaller andsmaller.
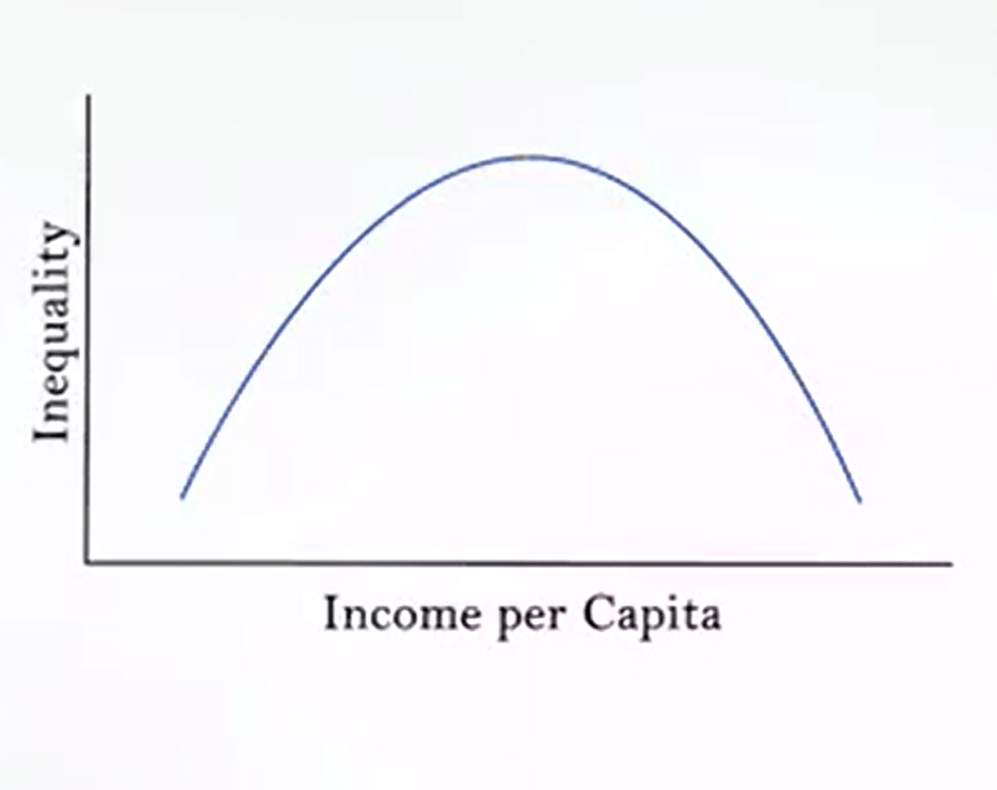
It has been suggested that economic growth follows by diversity protection. According to the Curve, the Curve was first advanced bythe economist Simon in 1950 and 60 years. This curve graphs the hypothesis that as an economy develops market forces first increase and then decrease economic inequality.
The most famous economic journal The Economist published a special report on economic growth and biodiversity titled The effect will grow the long view which are that contrary to the popular belief economic growth may be good for biodiversity.
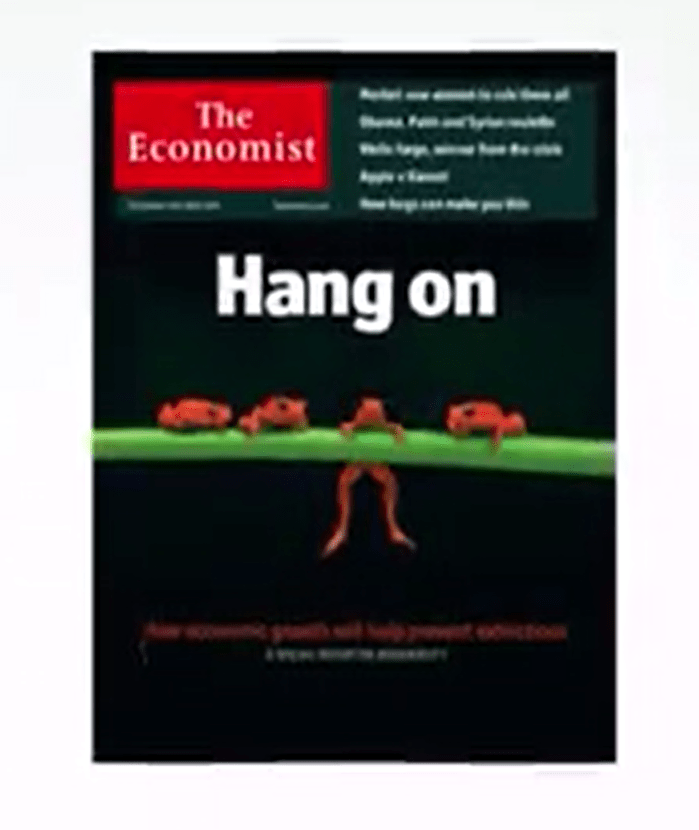
The quoted British magazine offered a distorted view in an attempt to reverse years of effortto bringing the right place the concept of sustainable development, economic growth and well being. The idea is to pass the theory that the that the current decline in the world’s biodiversity due to uncontrolled adverse economic development is unfounded.
The analysis however is superficial and often unconsistent. It fails to mention that natural and human history trying to justify its thesis by comparing different policies to protectthe environment of neighbor countries.
Even if the awareness to keep a sustainable model of life in the western countries is increasing, in this decade many developing countries are experiencing economic growth putting a weak threat their environment.

The critical analysis I carried out suggests instead that society follows a common pattern ofdevelopment from the indigenous lifestyle to poor society to a developing country to a developed country. Following these steps if society exploits is not very resources during the economic development towards its civilization.

Legg igjen en kommentar