Hi guys. Welcome to the sixth lecture of the courseBiological Diversity, Theories, Measures, and Data sampling techniques. Last time I told you about distributionof biodiversity microscale. Today I will explain you some generalpatterns in microscale on biodiversity distribution.
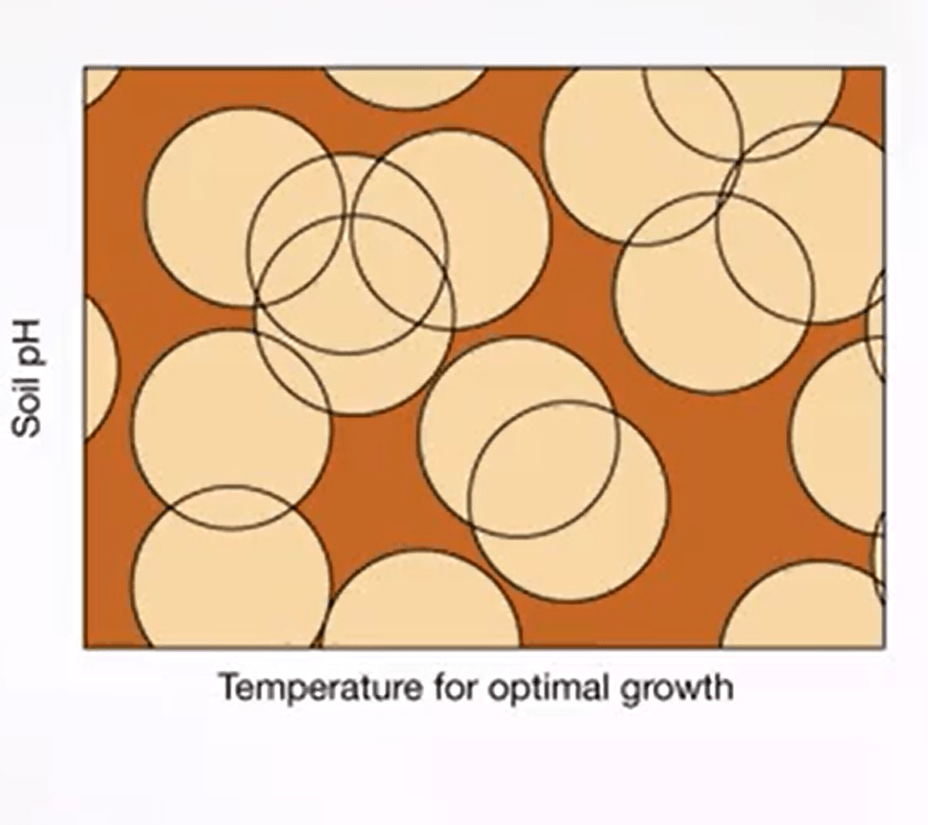
Let’s start to explain the biomass biodiversity relation. Let’s have a look at the figure letter a. It’s a simple model, is normal,at the bottom model, of niche differentiation mico resistance. The range of condition in which each species can exist is shown with the circle, and the position whichis defined is by the center. By randomly choosing locations,for values, numbers, or circles that are species,it is possible to calculate the effect of diversity on the coverage,of such heterogeneous habitat. The amount of such coverage isproportional to community biomass.
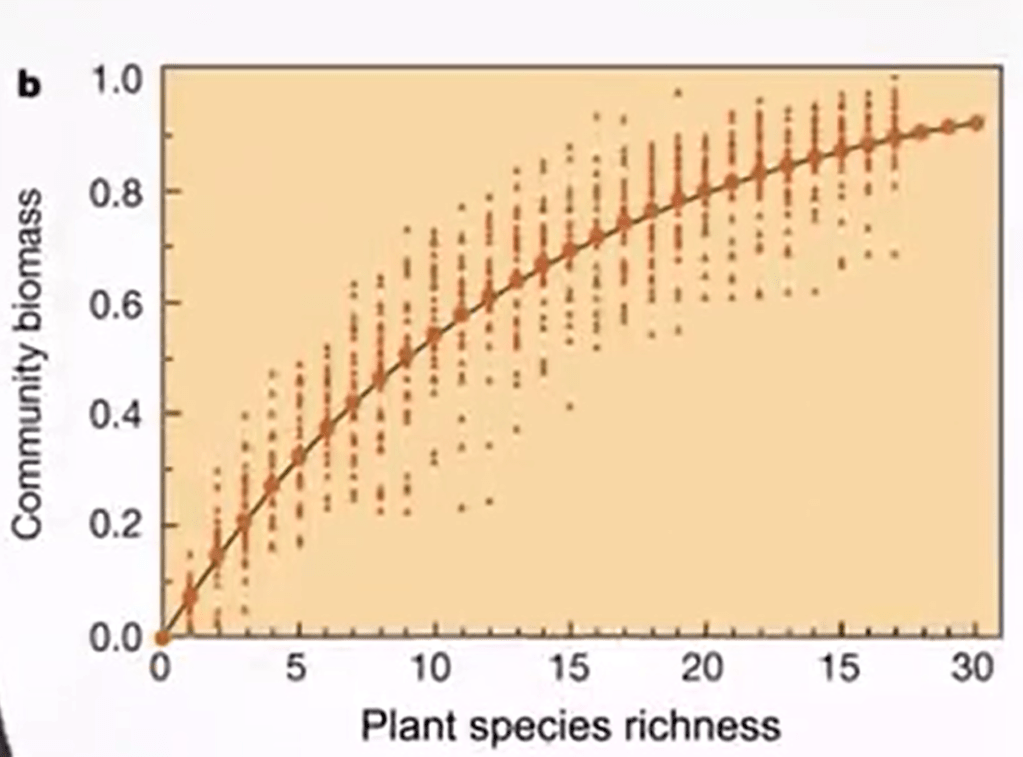
In the figure, letter b, we can see thereis also simulation that are triangles, and the analytical solution that are solid curves to the effect of diversity on community productivity. For the or the bottom mode, so the mode in the letter a.
The relation between biomass andbiodiversity is a fundamental relation. It is better to use a functional richness instead of a species richness to understand this pattern. We observe an increase of production efficiency of species in producing biomass when more ecological interaction are present. Second, the fact that communities are likely assembled in order succession, and in order successional species fromlow to high ecological efficiency.
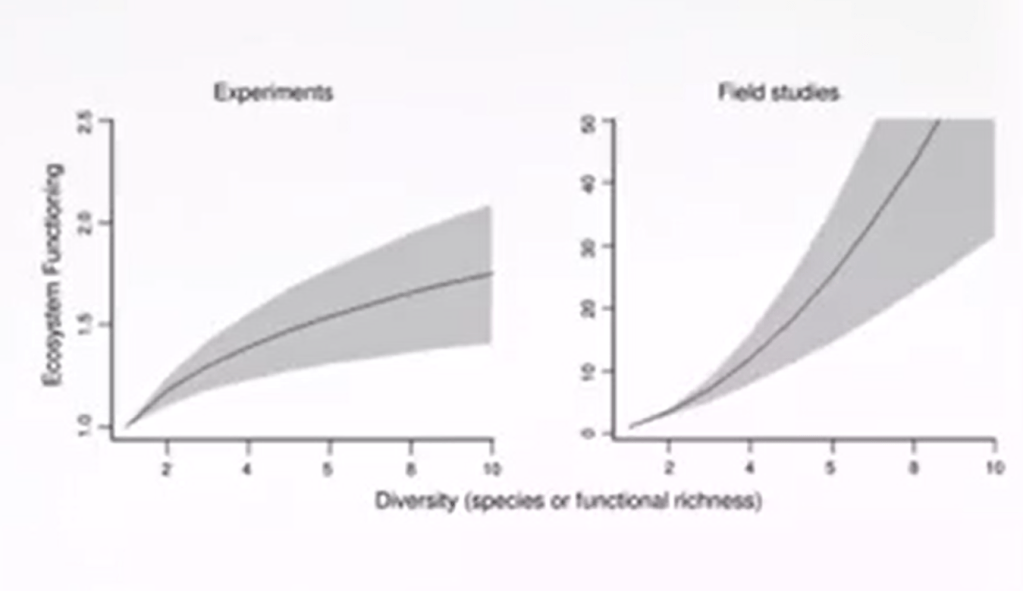
The relation between biomass and biodiversity attracts our attention today the ecological system services. Human depends, on large degree, on the goods providedby the natural and ecosystem. These goods and other benefits provided by ecosystem to mankind are qualitatively referred to as ecosystem services. Anthropogenic activities impact the diversity of organisms, found in ecosystem aboveground and belowground and thus influence the provision of ecosystem services. Consequently, there has beenan increasing scientific interest in the link between biodiversity andthe provision of ecosystem services, but researchers focus mainlyon the aboveground systems.

I will explain what is a primary succession. Primary succession occurs inexcess of the lifeless areas, regions in which the soil is incapable of sustaining life, as a result of such factors as lava flows, newly formed sand dunes, or rocks left from the retreating glacier.
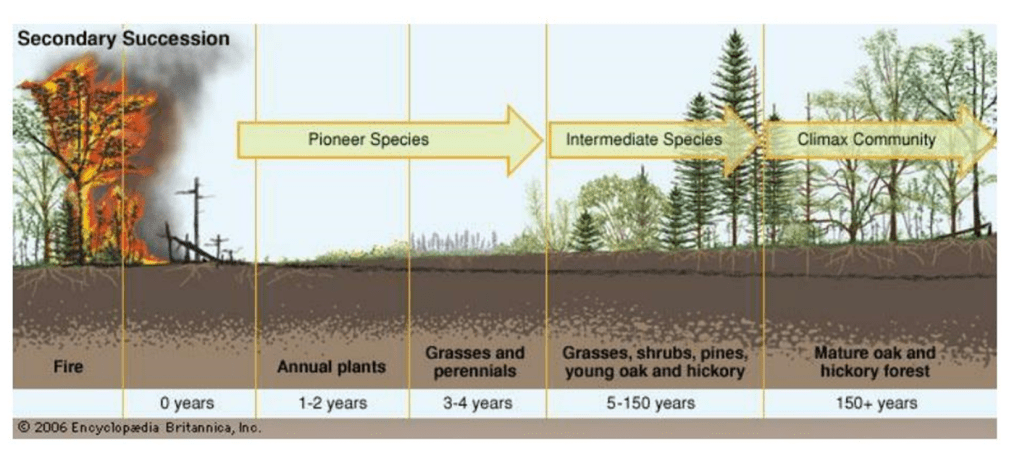
Secondary succession instead, of course, an area where a community that previously existed has been partially orcompletely destroyed. Disturbance regimens are very importantin this case, for instance, fire, logging, storms, and others.
Clements

The scientist Clements introducedthe idea of climax for the successions. So we need to understand what is a climax,and what’s the functional changesduring this succession. Clements described the successionaldevelopment of a ecological community comparable to the autogenicdevelopment of an individual organism.
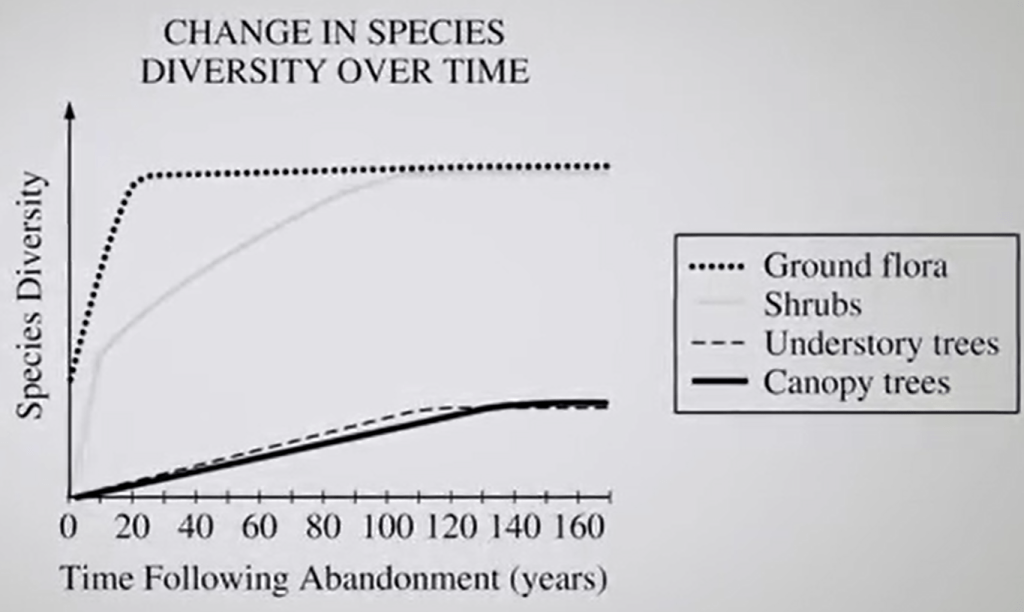
Later, ecologists developed this idea that ecological community is a super organism. And even sometimes claimed that communities could be analogous to complex organism, and so to definea single climax type for each area. Species diversity almost necessarily increases during early succession as new species arrive, but may stabilize in later successional stage.
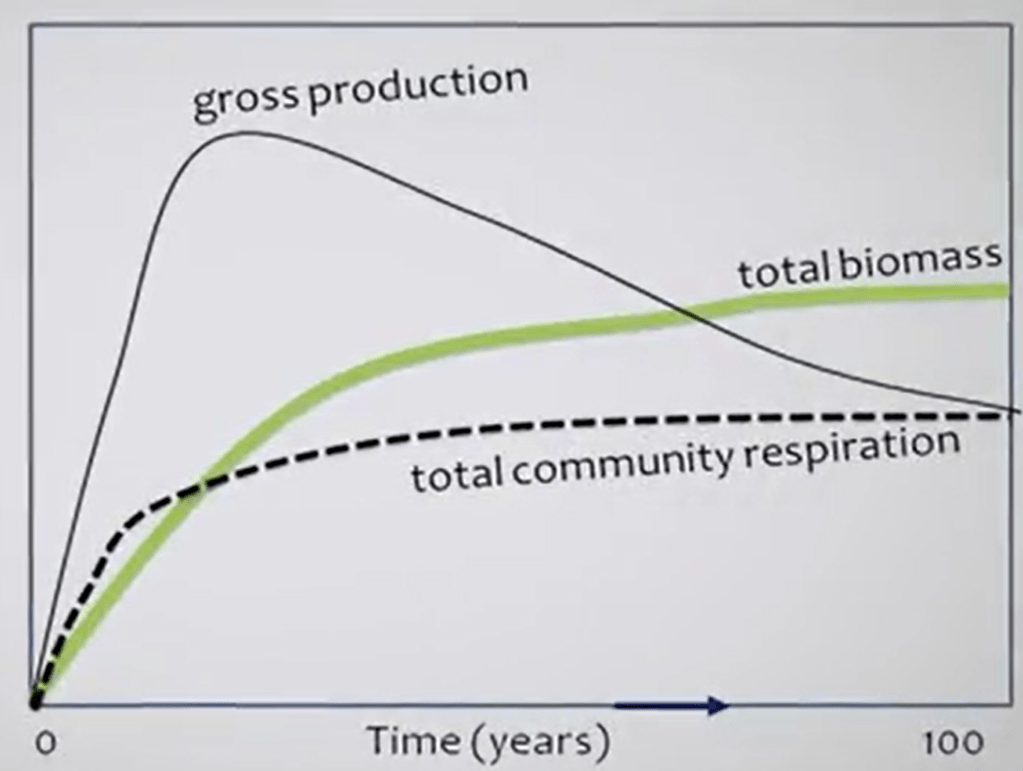
Net primary productivity, biomass, andtrophic properties all show variable patterns over succession dependingon the particular system and size.
Early seral stages are marked by rapidgrowth and biomass accumulation. Grasses, herbs as more shrub, forinstance, increase their population and their biomass. Gross primary productivity is low, butnet primary productivity tends to be a large proportion of grossprimary productivity. As with the little biomass, in the early seral stage, respiration is low. As the community develops toward woodland and biomass increases, so does productivity. But net primary production as a percentageor gross primary production can fall as respiration rates increase with more biomass.
Intermediate Disturbance Hypothesis
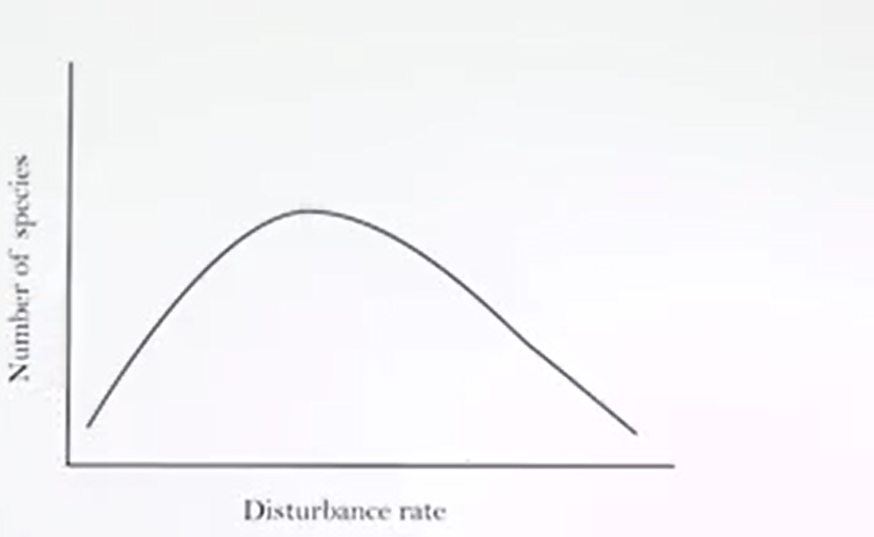
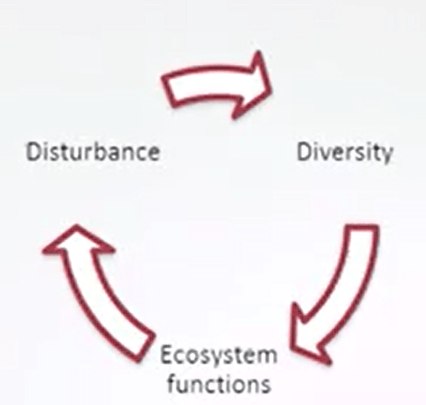
One key factor ofsuccession is facilitation. The intermediate disturbance hypothesishas been proposed to explain how species can coexist in the same environment, leading to biodiversity. Diversity of species in the ecosystem ismaintained by a level of intermediate disturbance. So this is why you see this kind ofhump shaped curves on the graph. If disturbance is infrequent, the subsection may fall to develop behind the pioneer stage. If the disturbance is rare, the climax will be established and diversity reduced according to the competitive exclusion principle.
At the intermediate level of disturbance,instead, the arrival of new species will increase the diversity in proportion to the interval between disturbances. But because the competitive exclusionprinciple is being questioned, this hypothesis is still dubious. At the contrary, three other processeshave been suggested to explain the coexistence of species,in other words, biodiversity. The first is the stabilization of a consistent function, the second is the insurance hypothesis, and the third is the portfolio effect. Increasing diversity canstabilize a consistent function.
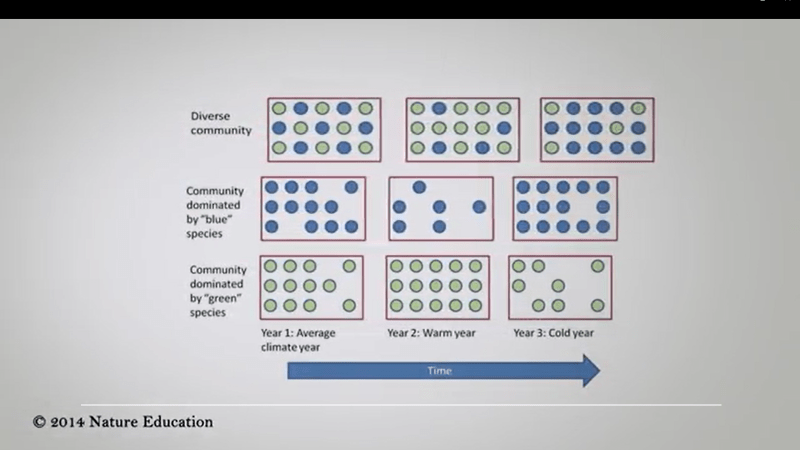
In this illustration, you’ll see that each rectangle represents a planned community containing individuals of either blue orgreen species and the total number of individuals correspond to the productivity of the ecosystem. Green species increase inabundance in warm years, where as blue species increase in abundance in cold years. Such that the community containing onlyblue or green species will fluctuate in biomass when there is an interannual climate variability. In contrast, in the community contain both blue and green individuals, the decrease in one species is compensatedfor an increase in the other species, thus, creating stability in ecosystem productivity between years. You should note also, that on average, the diverse community exhibits higher productivity than either single species community. This pattern could occur if blue or green species are active at slightly different times, such that competition between the two species is reduced. This difference in when the speciesare active, leads to the complementary resource utilization and can increasethe total productivity of the ecosystem.
Insurrance hypothesis
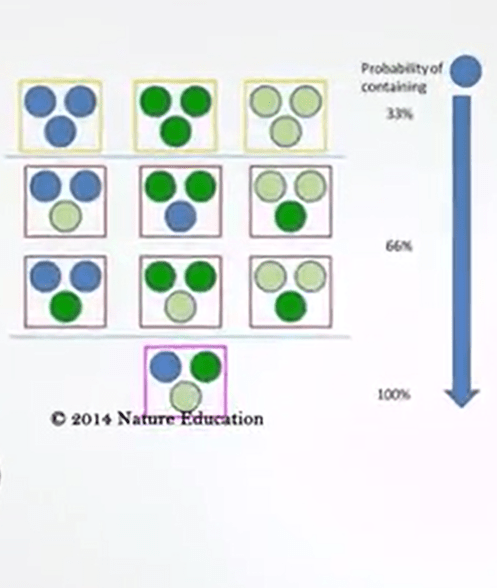
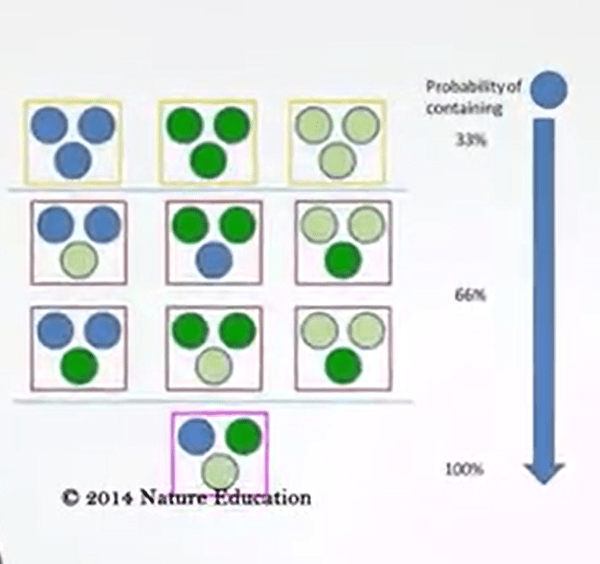
The second is the insurance hypothesis. Simple communities are represented by a box in this figure. In this case, these communities are too small that can only contain three individuals. For example, this could be the case for a small pocket of soil on a rocky slope. There are three potential species that can colonize these communities, blue, dark green, and light green. And for the sake of this example, let’s assume that the blue species have traits that allow it to survive fora longer drought. Looking at all possible combinations, a community containing one, two, or three species, we see that asthe number of species goes up, the probability of containing the blue species also goes up. Thus if slopes in this region were to experience a prolonged drought, the more diverse community will be more likely to maintain primary productivity because of the increased probability of having the blue species present.
Portfolio effect
The third hypothesis is the portfolio effect. The portfolio effect compares community with a stock portfolio. This was an idea provided by Tilman and other authors in 1998. Consider two different portfolios, one with two stocks in the figure left-hand side and one with fourstocks in the figure right-hand side, each with a total valueof $100 in the top panel. A stochastic event causes a 50%reduction in the value of stock A in the bottom panel. In the portfolio with only two stocks, this leads to an overall loss of $25, whereas only $12.50 are lost inthe portfolio with four stocks. Similarly, a decrease in the abundanceof one species during a disturbance event will have a large impact in thespecies poor communities than species rich communities. And the function in the diverse communities are therefore likely to all show a lower response. Moreover, the relative abundance of species within communities may also influence our ecosystem function in response to disturbances.
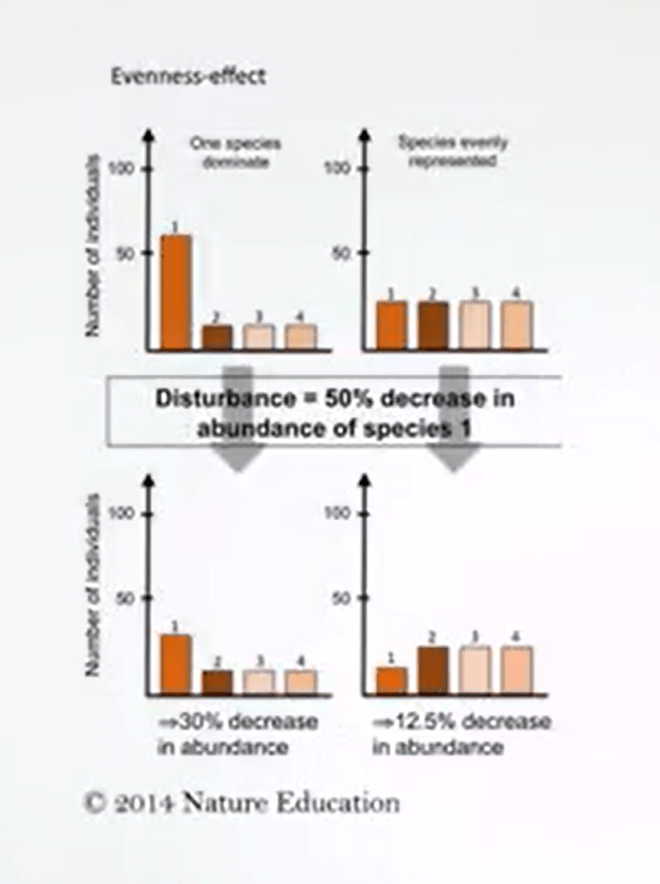
Consider two communities with four species each, but one is dominated by one species, low evenness in the left-hand side of the figure, while the four species are evenly represented in the other, high evenness in the right-hand side of the figure. A disturbance event leads to a 50%decrease in the abundance of species one in both communities. In the community dominated by one species, this leads to a 30% reductionin overall abundance, but only a 12.5% reduction in the community with evenness. This is likely to result in greater reduction in functioning in the community with high dominance than in the community with the high evenness. Thus, communities with many species and high evenness are likely to show smaller responses to external stimuli than communities with few species and high dominance by a single species. Now you can understand how biodiversity is very important for the ecosystem. We will continue the discussion during the next lecture.

Legg igjen en kommentar